To view previous releases, select one from the dropdown box:
Currently displaying information released on: April, 2017
ANALYSIS OF NOVA SCOTIA'S CONSUMER PRICE INDEX FOR MARCH 2017
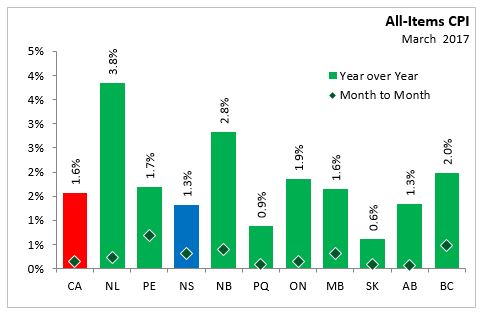
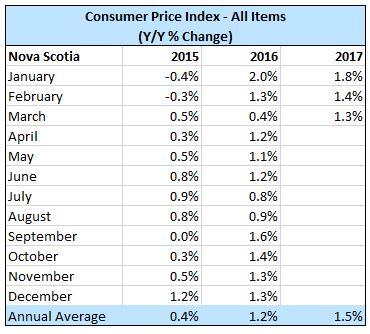
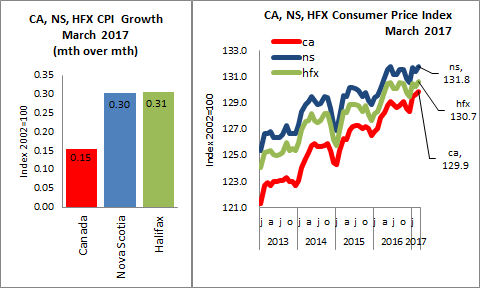
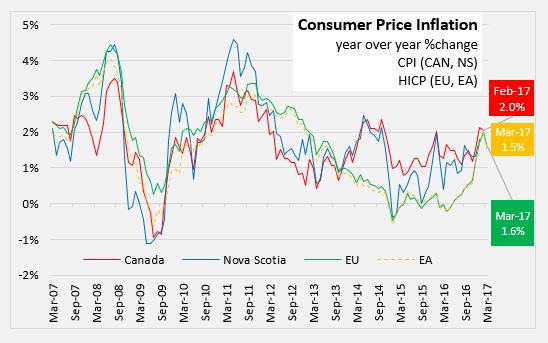
In Nova Scotia March 2017, annual consumer price inflation (year-over-year growth) was 1.3 per cent, below the national average of 1.6 per cent. Monthly consumer prices increased 0.3 per cent in Nova Scotia, while nationally prices increased 0.2 per cent.
Within Atlantic Canada, Newfoundland and Labrador (+3.8 per cent), New Brunswick (+2.8 per cent) had the highest annual inflation compared with Prince Edward Island (+1.7 per cent) and Nova Scotia (+1.3 per cent). On July 1, 2016, the provincial component of the harmonized sales tax (HST) increased in both Newfoundland and Labrador and New Brunswick. In Prince Edward Island, the provincial component of the HST was increased effective October 1, 2016.
All other provinces experienced positive annual inflation in March.
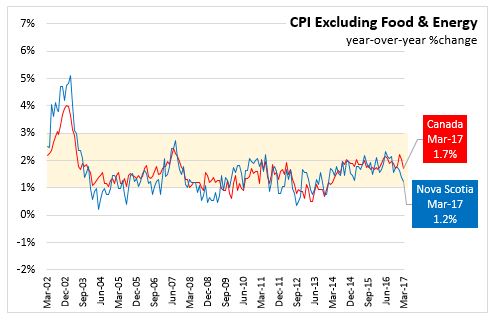
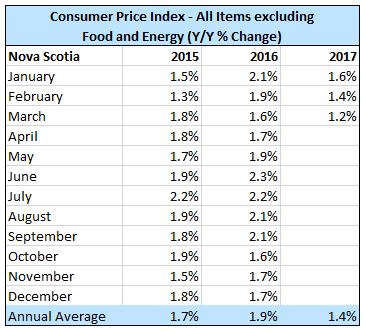
Nova Scotia's annual consumer price inflation (year over year growth in CPI) excluding food and energy rose 1.2 per cent in March, below the national rate of 1.7 per cent. Price level gains for this index were largest in Newfoundland and Labrador (+3.1 per cent) and New Brunswick (+2.8 per cent) and lowest in Saskatchewan (+0.4 per cent). On a monthly basis, Nova Scotia's index excluding food and energy increased 0.3 per cent.
The main contributors to the monthly (March 2017 vs. February 2017) NS CPI movement:
Sugar and confectionery (+7.8%)
Footwear (+5.6%)
Non-electric kitchen utensils, tableware and cookware (-14.8%)
Fresh or frozen beef (-6.0%)
The main contributors to the annual (March 2017 vs. March 2016) NS CPI movement:
Gasoline (+17.9%)
Fuel oil and other fuels (+15.0%)
Fresh or frozen beef (-24.1%)
Fresh vegetables (-20.7 per cent)
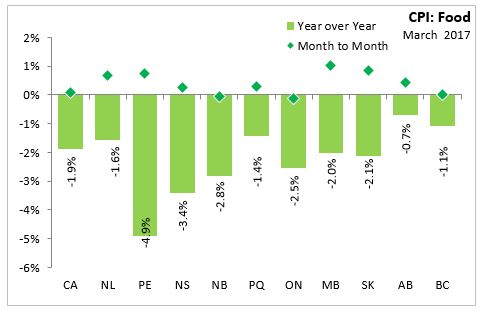
The CPI for food in Nova Scotia declined 3.4 per cent year-over-year with a 0.3 per cent increase month-over-month. CPI growth in food (year over year) declined in all provinces, with the largest decline in Prince Edward Island. Nationally, annual food prices declined 1.9 per cent.
The Nova Scotia energy index increased by 11.1 per cent compared to a year ago. Energy prices were higher in all provinces compared to a year ago. Energy prices saw the largest increase in Newfoundland and Labrador (+18.5 per cent) and PEI (+12.9 per cent).
Major Components
The following table shows the price increases specific to Nova Scotia for the major components of the CPI this month: 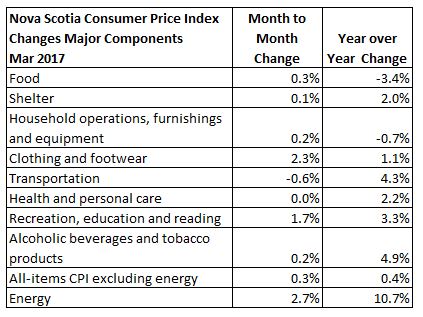
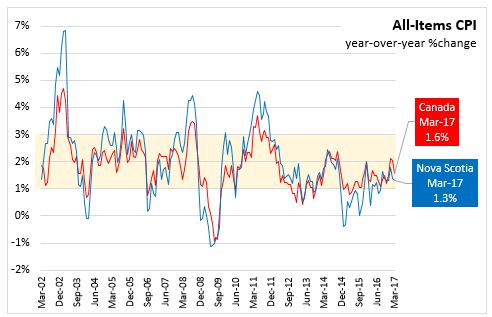
Long Run Trends
The All-Items CPI annual inflation rate for Nova Scotia was below Canada's in March 2017. Since June 2014, Nova Scotia's annual inflation has been below the Canadian average except for three months in 2016: January, September and November. While month to month movements in the indices can be different, over time they generally follow the same overall trend.
Annual inflation for the CPI excluding food and energy was lower for Nova Scotia (+1.2 per cent) than for Canada (+1.7 per cent).
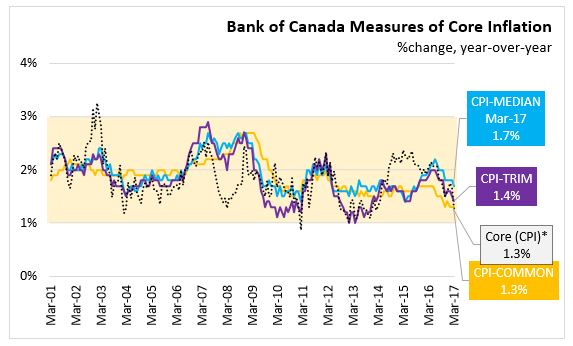
Bank of Canada's preferred measures of core inflation
Compared with March 2016, CPI-Common rose 1.3 per, CPI-Median rose 1.7 per cent, and CPI-Trim rose 1.4 per cent in Canada. All-items CPI excluding eight of the most volatile components as defined by the Bank of Canada and excluding the effect of changes in indirect taxes (formerly referred to as CPIX) rose 1.3 per cent year over year in March 2017.
Appendix Tables
Source: Statistics Canada CANSIM Tables 326-0020 , 326-0023 CONSUMER PRICE INDEX MARCH 2017
NOVA SCOTIA
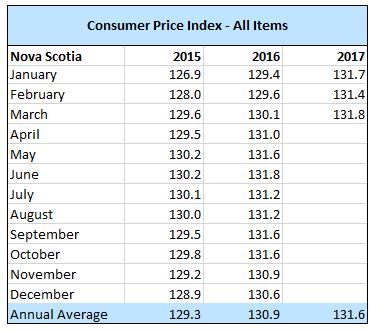
In Nova Scotia March 2017, the consumer price index (2002=100) increased 0.3% from February 2017 to 131.8 and increased 1.3% over March 2016.
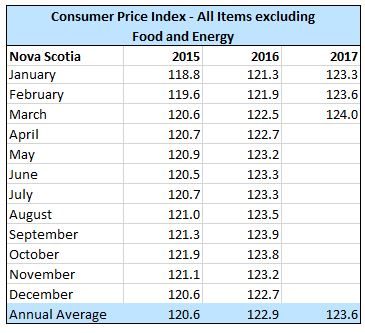
The CPI, excluding food and energy, increased 0.3% from February 2017 to 124.0, and increased 1.2% over March 2016.
CANADA
In Canada March 2017, the consumer price index (2002=100) increased 0.2% from February 2017 to 129.9 and increased 1.6% over March 2016.
The CPI, excluding food and energy, increased 0.3% from February 2017 to 125.2, and increased 1.7% over March 2016.
Compared with March 2016, CPI-Common rose 1.3%, CPI-Median rose 1.7%, and CPI-Trim rose 1.4%.
HALIFAX
In Halifax March 2017, the consumer price index (2002=100) increased 0.3% from February 2017 to 130.7 and increased 1.3% over March 2016.
Statistics Canada Note: Since 2001, the Bank of Canada's main measure of core inflation has been "core" consumer price index (CPIX) inflation, which excludes eight of the most volatile components of the CPI and adjusts the remainder for the effect of changes in indirect taxes. Following a review of a wide selection of measures of core inflation in 2015, in the context of its most recent renewal of the inflation-control target, the Bank chose three preferred measures of core inflation: (i) a measure based on a trimmed mean (CPI-trim); (ii) a measure based on the weighted median (CPI-median); (iii) a measure based on the common component (CPI-common). For more information see The Daily.
Statistics Canada Cat. No. 62-001, CANSIM 326-0020 326-0023 EU AND EURO AREA CONSUMER PRICE INFLATION, MARCH 2017
In March, annual inflation was 1.5 per cent in the Euro Area and 1.6 per cent in the European Union. In February, annual inflation was 2.0 per cent in the Euro Area and 2.0 per cent in the EU. In February 2016, inflation in the Euro Area and the EU was 0.0 per cent.
The highest annual rates were recorded in Latvia, Lithuania and Estonia. The lowest rates were registered in Romania, Ireland, and the Netherlands.
The largest upward impacts to euro area annual inflation came from fuels for transport, heating oil, and vegetables. Telecommunication, package holidays, and garments had the biggest downward impacts.
Source: Eurostat
|