To view previous releases, select one from the dropdown box:
Currently displaying information released on: March, 2018
ANALYSIS OF NOVA SCOTIA'S CONSUMER PRICE INDEX FOR FEBRUARY 2018
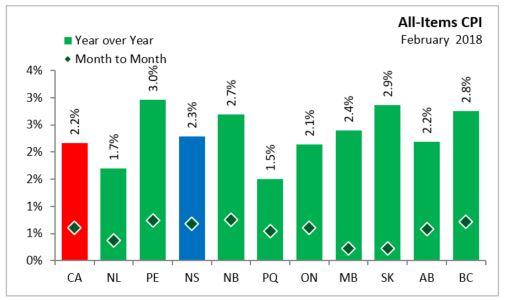
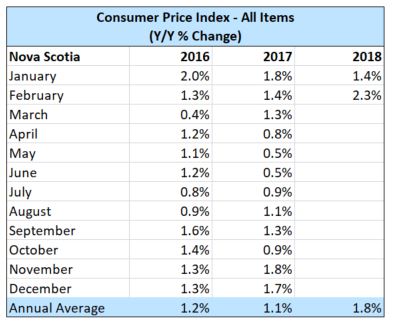
In Nova Scotia February 2018, year over year growth for the All-Items Consumer Price Index was 2.3 per cent, above the national average of 2.2 per cent. Monthly consumer prices were up 0.7 per cent in Nova Scotia and up 0.6 per cent in Canada.
Within Atlantic Canada, PEI (+3.0) and New Brunswick (+2.7 per cent) had higher inflation than Nova Scotia. Newfoundland and Labrador saw a 1.7 per cent increase in prices.
All other provinces experienced positive year over year inflation in February.
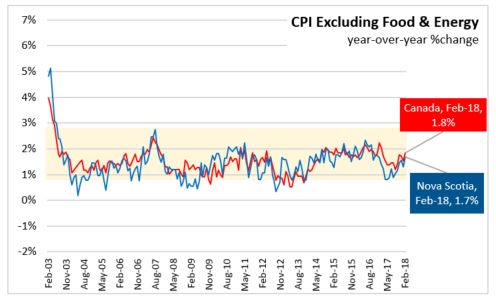
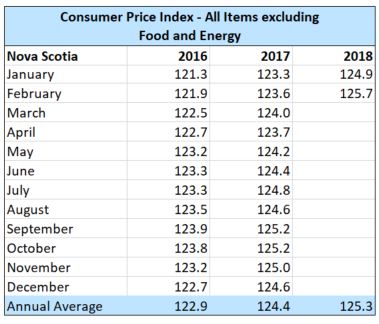
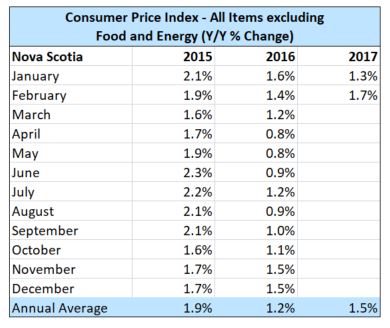
Nova Scotia's annual consumer price inflation (year over year growth in CPI) excluding food and energy rose 1.7 per cent in February, below the national rate of 1.8 per cent. Price level gains for this index were largest in New Brunswick and Saskatchewan (both +2.5 per cent), and lowest in Quebec (+1.0 per cent). On a monthly basis, Nova Scotia's index excluding food and energy was up 0.6 per cent.
The main contributors to the monthly (February 2018 vs. January 2017) NS CPI movement:
Preserved vegetables and vegetable preparations (+12.6%)
Processed meat (+7.9%)
Fresh fruit (-2.6%)
Non-alcoholic beverages (-4.7%)
The main contributors to the annual (February 2018 vs. February 2017) NS CPI movement:
Fuel oil and other fuels (+11.5%)
Gasoline (+8.5%)
Non-alcoholic beverages (-5.5%)
Recreational equipment and services (excluding recreational vehicles) (-8.4%)
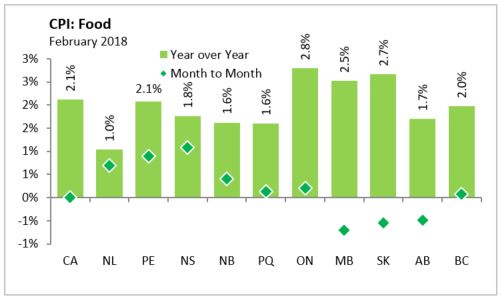
The CPI for food in Nova Scotia increased 1.8 per cent year-over-year with a 1.1 per cent increase month-over-month. CPI growth in food (year over year) was up in all provinces. Nationally, annual food prices increased 2.1 per cent.
The Nova Scotia energy index increased by 6.9 per cent compared to a year ago. Energy price growth was smallest in Newfoundland and Labrador on a year over year basis (+1.6%) and largest in Alberta (+12.3%). Nationally, the index was up 5.3 per cent.
Major Components for January 2018
The following table shows the price increases specific to Nova Scotia for the major components of the CPI this month:
Long Run Trends
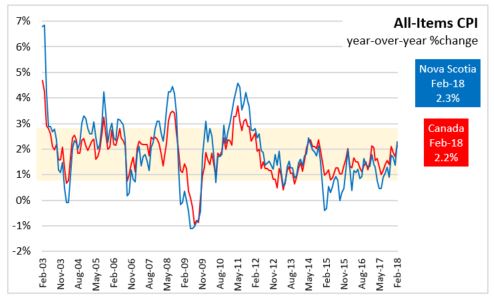
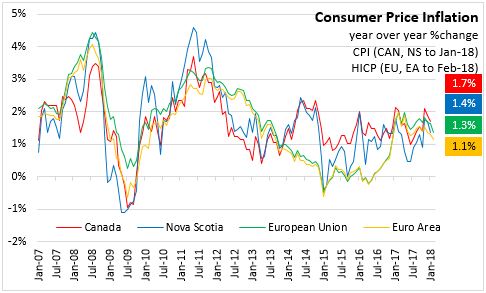
The All-Items CPI year over year inflation rate for Nova Scotia was above Canada's in February 2018. Since June 2014, Nova Scotia's annual inflation has been below the Canadian average except for three months in 2016: January, September and November. While month to month movements in the indices can be different, over time they generally follow the same overall trend.
Annual inflation for the CPI excluding food and energy was lower for Nova Scotia (+1.7 per cent) than for Canada (+1.8 per cent).
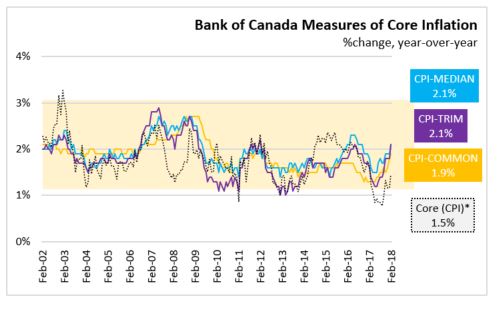
Bank of Canada's preferred measures of core inflation
Compared with February 2017, CPI-Common rose 1.9 per cent, CPI-Median rose 2.1 per cent, and CPI-Trim rose 2.1 per cent in Canada. All-items CPI excluding eight of the most volatile components as defined by the Bank of Canada and excluding the effect of changes in indirect taxes (formerly referred to as CPIX) rose 1.5 per cent year over year in February 2018.
Appendix Tables and Charts

Source: Statistics Canada CANSIM Tables 326-0020 , 326-0023 EU AND EURO AREA CONSUMER PRICE INFLATION, FEBRUARY 2018
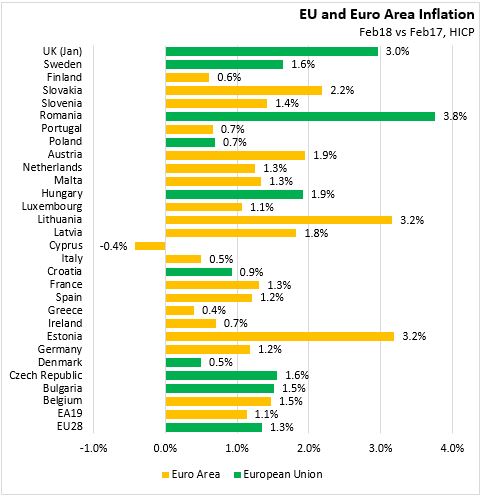
Inflation slowed in Europe in the February consumer price index results (compared with prices reported for February 2017). Inflation in the Euro Area slowed to 1.1 per cent while it slowed to 1.3 per cent for the European Union as a whole. Inflation in both Canada and Nova Scotia also slowed in the latest year-over-year results for January.
Among member states, the fastest inflation was reported in Romania, Lithuania, Estonia and the UK (Jan18 vs Jan17). Inflation was mostly slower in countries that use the Euro as their currency, including Malta, Finland, Italy Greece, Portugal and Ireland, though there was slower inflation as well in some countries outside the Euro Area: Denmark, Poland and Croatia.
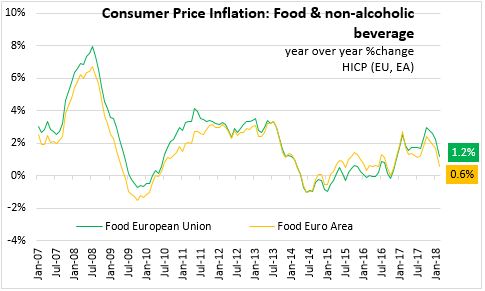
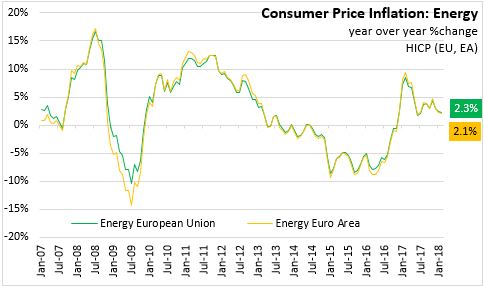
Over the last year, food and energy prices have contributed to higher inflation in Europe. In the latest results, however, both food and energy price inflation are continuing to slow.
Source: Eurostat
|