To view previous releases, select one from the dropdown box:
Currently displaying information released on: January, 2019
ANALYSIS OF NOVA SCOTIA'S CONSUMER PRICE INDEX FOR ANNUAL 2018
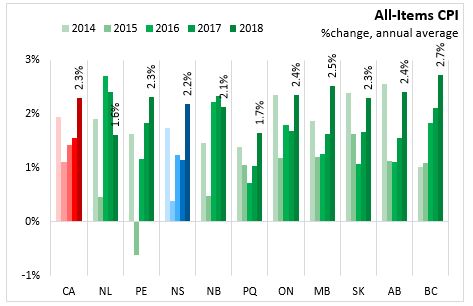
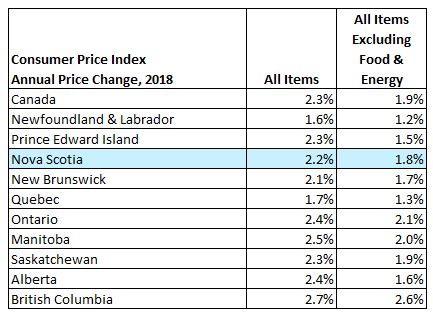
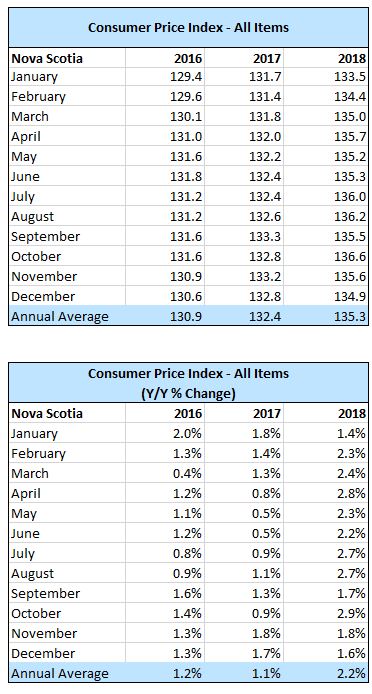
CPI inflation in Nova Scotia was 2.2 per cent for the year 2018, below the national increase of 2.3 per cent. For both Canada and Nova Scotia, the CPI increase was the largest since 2011. For 2018, the largest increase in the CPI occurred in British Columbia at 2.7 per cent and the lowest was in Newfoundland and Labrador at 1.6 per cent. The increase of the CPI was larger in 2018 than 2017 for eight provinces, but smaller in Newfoundland and Labrador and New Brunswick.
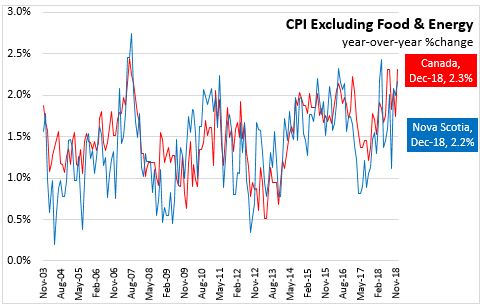
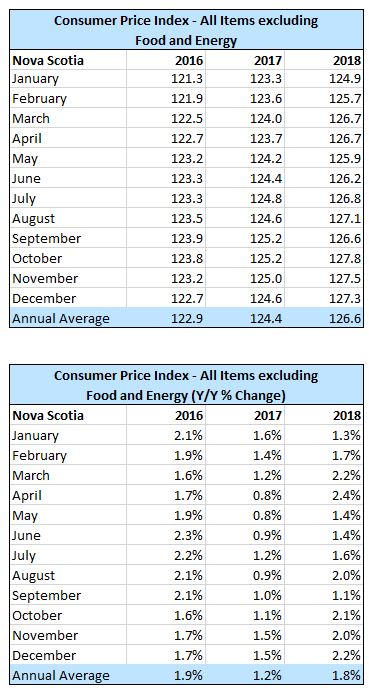
The CPI excluding food and energy increased 1.8 per cent in Nova Scotia in 2018 and rose 1.9 per cent in Canada. The largest increase for the CPI excluding food and energy was in British Columbia at 2.6 per cent while the smallest increase was in Newfoundland and Labrador (+1.2%).

Major Components for 2018
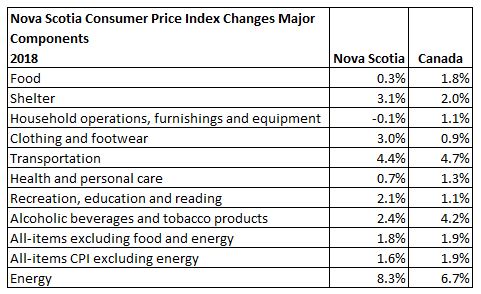
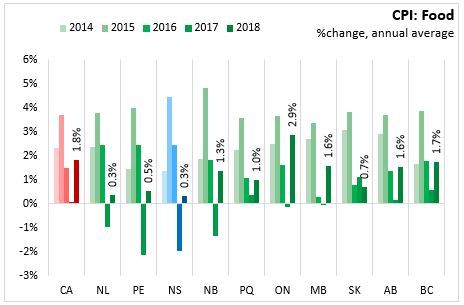
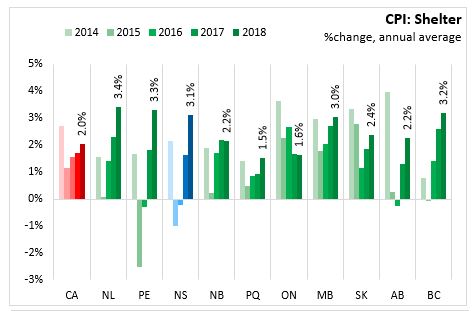
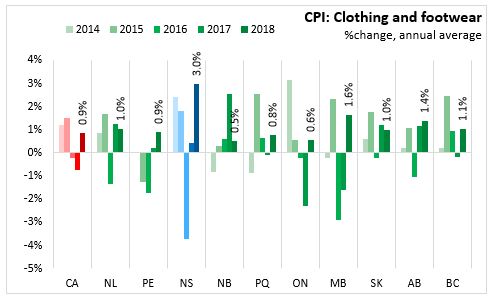
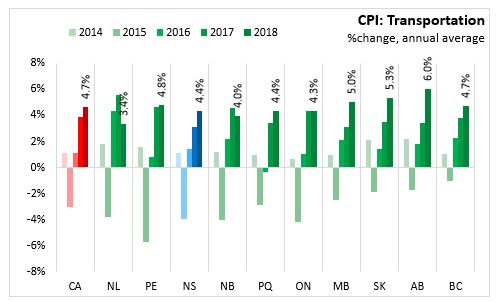
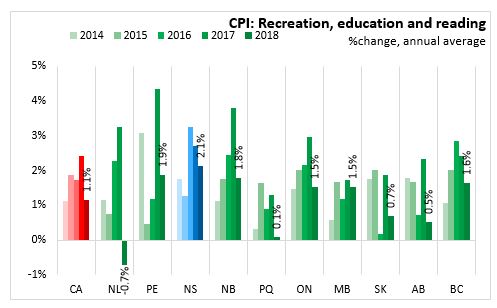
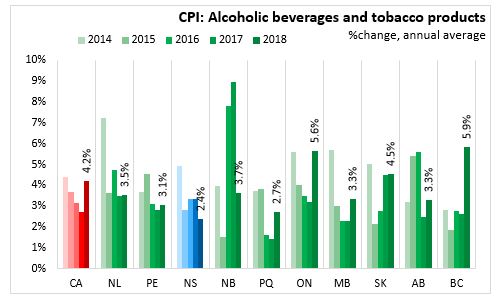
For Nova Scotia, all the major components of the consumer price index increased except household operations, furnishings and equipment(-0.1%) in 2018. After a decline in 2017, food price in Nova Scotia rose 0.3 per cent with an increase in food purchased from restaurants offsetting a further decline in food prices at stores. Shelter prices increased 3.1 per cent in Nova Scotia in 2018 in part due to an increase in fuel oil and other fuels (+15.7%). Clothing and footwear prices were up 3.0 per cent in Nova Scotia in 2018, but the clothing and footwear index (99.6) remains similar to the base year of 2002. Transportation costs rose in both Nova Scotia and Canada with higher energy prices. Inflation decelerated for both the health and personal care and recreation, education, and reading components in both Canada and Nova Scotia in 2018. Prices for alcoholic beverages and tobacco rose 2.4 per cent in Nova Scotia in 2018.

Source: Statistics Canada. Table 18-10-0005-01 Consumer Price Index, annual average, not seasonally adjusted
ANALYSIS OF NOVA SCOTIA'S CONSUMER PRICE INDEX FOR DECEMBER 2018
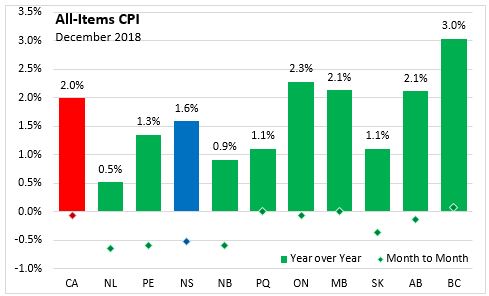
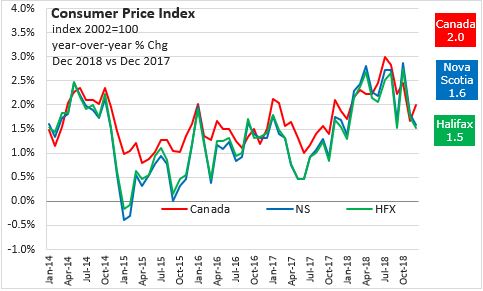
In Nova Scotia December 2018, year over year growth for the All-Items Consumer Price Index was 1.6 per cent, below the national average of 2.0 per cent. Monthly consumer prices were down 0.5 per cent in Nova Scotia and down 0.1 per cent nationally.
Within Atlantic Canada, Nova Scotia had the highest year over year consumer price inflation (+1.6%), followed by Prince Edward island (+1.3%) and New Brunswick (+0.9%), then Newfoundland and Labrador (+0.5%).
In December 2018, all provinces experienced positive year over year inflation, the highest in British Columbia (+3.0%).
Nova Scotia's consumer price inflation (year over year growth in CPI) excluding food and energy rose 2.2 per cent in December, below the national rate of 2.3 per cent. Price level gains for this index were largest in British Columbia (+3.2 per cent), and lowest in Newfoundland and Labrador (+0.9 per cent). On a monthly basis, Nova Scotia's index excluding food and energy was down 0.2 per cent.
The main contributors to the monthly (December 2018 vs. November 2018) NS CPI movement:
Inter-city transportation (+20.6%)
Fresh Vegetables (+10.0%)
Gasoline (-7.5%)
Traveller accommodation (-19.6%)
The main contributors to the annual (December 2018 vs. December 2017) NS CPI movement:
Inter-city transportation (+26.6%)
Fuel oil and other fuels (+11.0%)
Gasoline (-10.6%)
Traveller accommodation (-18.4%)
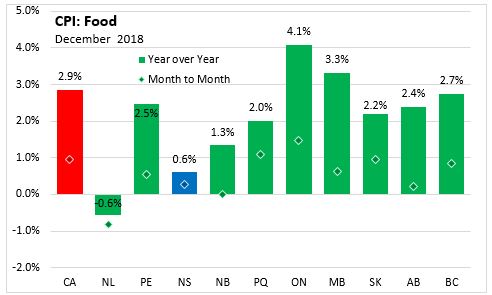
The CPI for food in Nova Scotia increased 0.6 per cent year-over-year with a 0.3 per cent increase month-to-month. CPI growth in food (year over year) was up in all provinces, except Newfoundland and Labrador. Ontario showed the highest year over year food price growth (+4.1%). Nationally, annual food prices increased 2.9 per cent.
The Nova Scotia energy index decreased by 1.7 per cent compared to a year ago. Energy price declined the most in Ontario (-7.5 per cent) on a year over year basis, and had the largest growth in Alberta (+2.2%). Nationally, the index was down 3.7 per cent.
Year over year, the consumer price index for shelter increased by 3.1 per cent in Nova Scotia and 2.2 per cent in Canada.
Major Components for December 2018
The following table shows the price increases specific to Nova Scotia for the major components of the CPI this month:
Long Run Trends
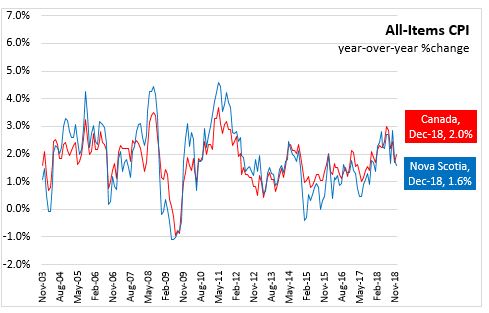
The All-Items CPI year over year inflation rate for Nova Scotia was below Canada's in December 2018. Nova Scotia's annual inflation has remained below the Canadian average since mid-2014, with the exception of only a few months. While month to month movements in the indices can be different, over time they generally follow the same overall trend.
Annual inflation for the CPI excluding food and energy was lower for Nova Scotia (at 2.2 per cent) compared to Canada in December.
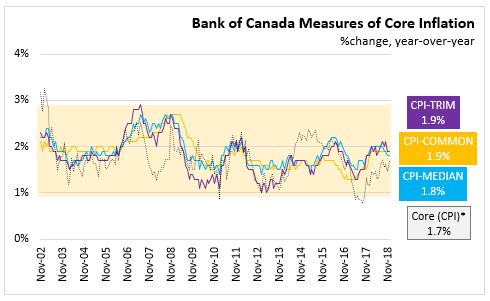
Bank of Canada's preferred measures of core inflation
Compared with December 2017, CPI-Trim and CPI-Common rose 1.9 per cent and CPI-median was up 1.8 per cent in Canada. All-items CPI excluding eight of the most volatile components as defined by the Bank of Canada and excluding the effect of changes in indirect taxes (formerly referred to as CPIX) rose 1.7 per cent year over year in December 2018.
Appendix Tables and Charts
Source: Statistics Canada data portal: Tables 18-10-0004-01 and 18-10-0256-01 CONSUMER PRICE INDEX, DECEMBER and ANNUAL 2018
DECEMBER 2018
NOVA SCOTIA
In Nova Scotia December 2018, the Consumer Price Index (index 2002=100) decreased 0.5 per cent from November 2018 to 134.9 and increased 1.6 per cent over December 2017. The CPI, excluding food and energy, decreased 0.2 per cent from November 2018 to 127.3 and increased 2.2 per cent over December 2017.
CANADA
In Canada December 2018, the Consumer Price Index (index 2002=100) decreased 0.1 per cent from November 2018 to 133.4 and increased 2.0 per cent over December 2017. The CPI, excluding food and energy, increased 0.1 per cent from November 2018 to 128.5 and increased 2.3 per cent over December 2017.
In Canada December 2018, year-over-year inflation in CPI-Common was 1.9 per cent, CPI-Median was 1.8 per cent and CPI-Trim was 1.9 per cent.
HALIFAX
In Halifax December 2018, the Consumer Price Index (index 2002=100) decreased 0.6 per cent from November 2018 to 133.5 and increased 1.5 per cent over December 2017.
ANNUAL
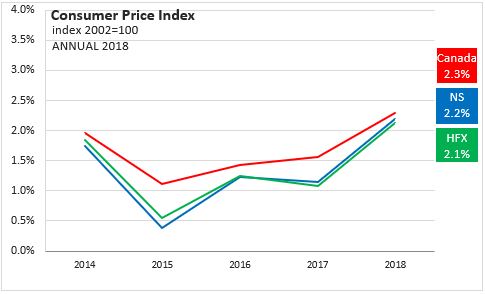
In Nova Scotia 2018, the Consumer Price Index (index 2002=100) increased 2.2 per cent over 2017.
In Canada 2018, the Consumer Price Index (index 2002=100) increased 2.3 per cent over 2017.
In Halifax 2018, the Consumer Price Index (index 2002=100) increased 2.1 per cent over 2017.
NOTES
Statistics Canada Note: Since 2001, the Bank of Canada's main measure of core inflation has been "core" consumer price index (CPIX) inflation, which excludes eight of the most volatile components of the CPI and adjusts the remainder for the effect of changes in indirect taxes. Following a review of a wide selection of measures of core inflation in 2015, in the context of its most recent renewal of the inflation-control target, the Bank chose three preferred measures of core inflation: (i) a measure based on a trimmed mean (CPI-trim); (ii) a measure based on the weighted median (CPI-median); (iii) a measure based on the common component (CPI-common). For more information see The Daily.
REFERENCES
Statistics Canada Cat. No. 62-604,Statistics Canada Tables:
18-10-0004-01
18-10-0256-01 year-over-year inflation
18-10-0005-01 ANNUAL
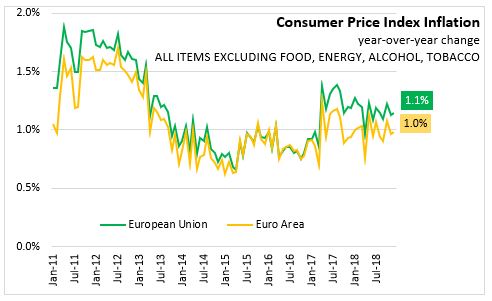
EU AND EURO AREA CONSUMER PRICE INFLATION, DECEMBER 2018 AND 2018 ANNUAL
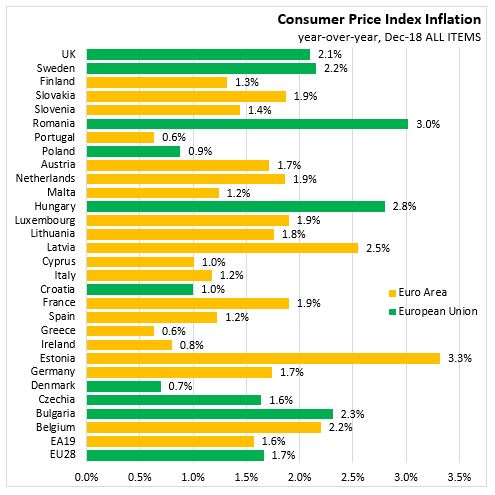
In December, the year-over-year inflation rate slowed to 1.7 per cent in the European Union and to 1.6 per cent in the Euro Area.

Among member states, the fastest year-over-year inflation was reported in Estonia and Romania, while the lowest inflation was reported in Denmark, Portugal and Greece.
December food price inflation remained at 1.3 per cent (year-over-year) in both the European Union and the Euro Area.

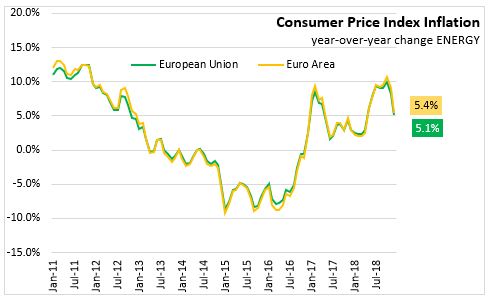
Energy inflation also slowed with the year-over-year inflation rate falling to 5.1 per cent in the European Union and to 5.4 per cent in the Euro Area.
Excluding the impacts of volatile energy, food, alcohol and tobacco prices year-over-year inflation is much more subdued in Europe - rising by 1.1 per cent for the European Union and by 1.0 per cent for the Euro Area.
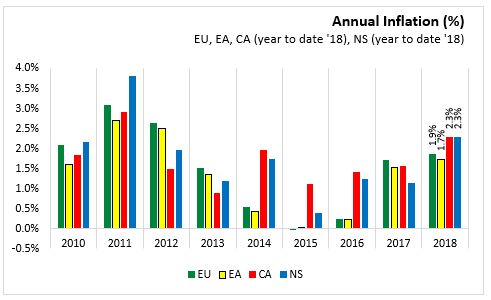
ANNUAL
In 2018, prices were up 1.9 per cent over 2017 in the EU, and were 1.7% higher than 2017 in the Euro Area. Prices in Nova Scotia and Canada are 2.3 per cent higher in the first 11 months of 2018 compared with the first 11 months of 2017. Note: Annual Consumer Price Index levels will be released for NS and Canada on January 18th, 2019.
Source: Eurostat-News Release
|