To view previous releases, select one from the dropdown box:
Currently displaying information released on: April, 2019
CONSUMER PRICE INDEX, MARCH 2019

NOVA SCOTIA
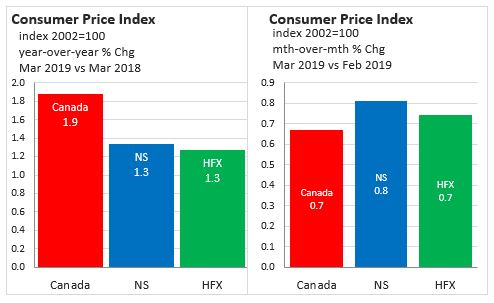
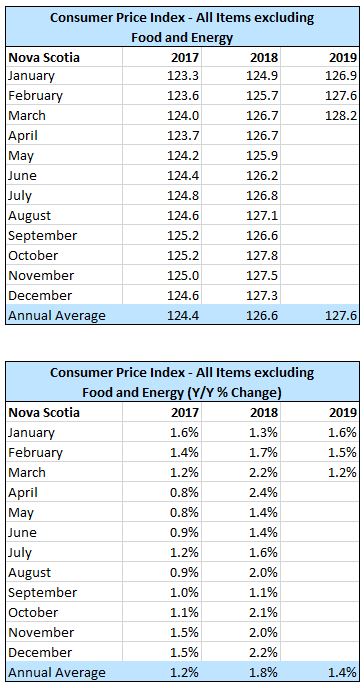
In Nova Scotia March 2019, the Consumer Price Index (index 2002=100) increased 0.8 per cent from February 2019 to 136.8 and increased 1.3 per cent over March 2018. The CPI, excluding food and energy, increased 0.5 per cent from February 2019 to 128.2 and increased 1.2 per cent over March 2018.
CANADA
In Canada March 2019, the Consumer Price Index (index 2002=100) increased 0.7 per cent from February 2019 to 135.4 and increased 1.9 per cent over March 2018. The CPI, excluding food and energy, increased 0.3 per cent from February 2019 to 130.0 and increased 1.9 per cent over March 2018
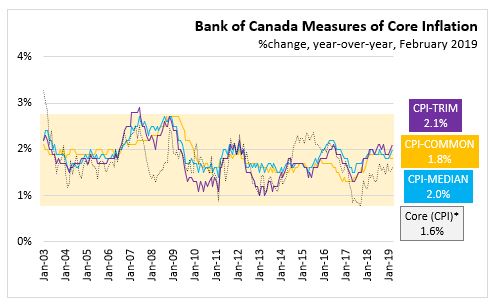
In Canada March 2019, year-over-year inflation in CPI-Common was 1.8 per cent , CPI-Median was 2.0 per cent and CPI-Trim was 2.1 per cent.
HALIFAX
In Halifax March 2019, the Consumer Price Index (index 2002=100) increased 0.7 per cent from February 2019 to 135.5 and increased 1.3 per cent over March 2018.
NOTES
Statistics Canada Note: Since 2001, the Bank of Canada's main measure of core inflation has been "core" consumer price index (CPIX) inflation, which excludes eight of the most volatile components of the CPI and adjusts the remainder for the effect of changes in indirect taxes. Following a review of a wide selection of measures of core inflation in 2015, in the context of its most recent renewal of the inflation-control target, the Bank chose three preferred measures of core inflation: (i) a measure based on a trimmed mean (CPI-trim); (ii) a measure based on the weighted median (CPI-median); (iii) a measure based on the common component (CPI-common). For more information see The Daily.
REFERENCES
Statistics Canada Cat. No. 62-604,
Statistics Canada Tables:18-10-0004-01 (formerly CANSIM 326-0020)
18-10-0256-01 (formerly CANSIM 326-0023) EU AND EURO AREA CONSUMER PRICE INFLATION, MARCH 2019
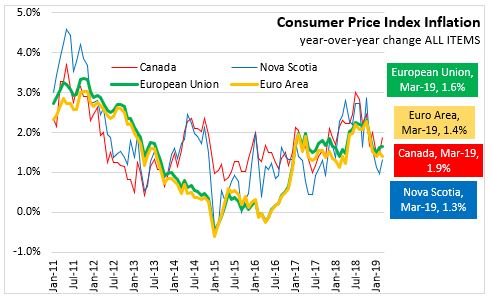
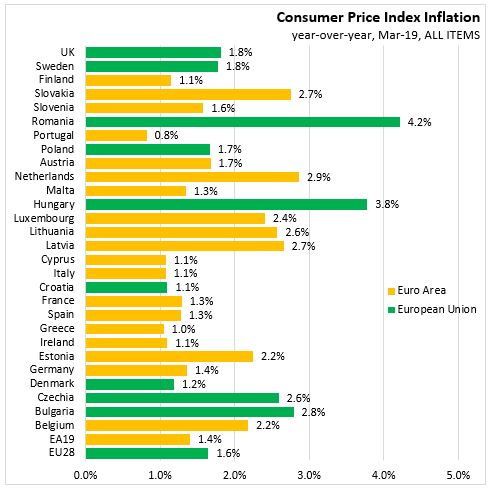
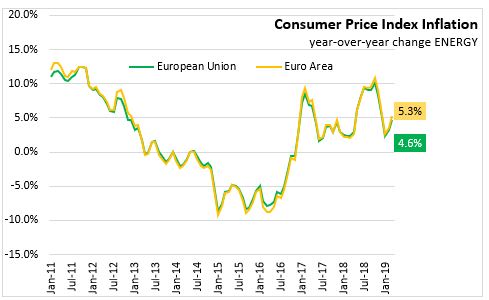
In March, the year-over-year inflation rate was unchanged at 1.6 per cent in the European Union and down 0.1 percentage points to 1.4 per cent in the Euro Area.
Among member states, the fastest year-over-year inflation was reported in Romania and Hungary, while the lowest inflation was reported in Portugal and Greece.
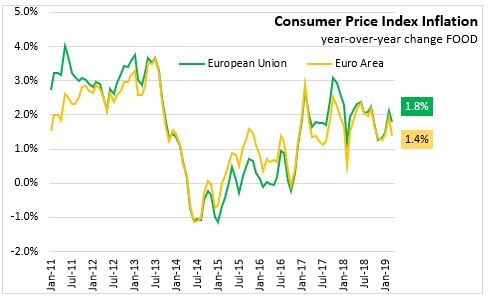
March 2019 food price inflation moved lower up to 1.9 per cent (year-over-year) in the European Union and to 1.4 per cent in the Euro Area.
Energy inflation rose with the year-over-year inflation rate at 4.6 per cent in the European Union and 5.3 per cent in the Euro Area.
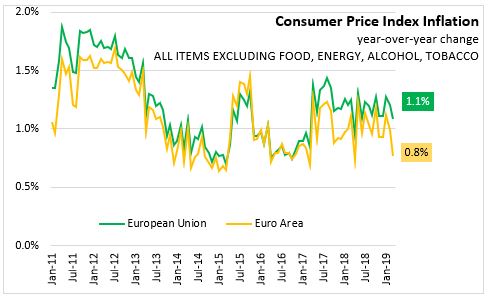
Excluding the impacts of volatile energy, food, alcohol and tobacco prices year-over-year inflation is more subdued in Europe - with declines in the year-over-year rate for the psat two months. In March 2019, the CPI excluding food, energy, alcohol and tobacco was 1.1 per cent for the European Union and 0.8 per cent for the Euro Area.
Note, Methodological changes was made to data starting in 2015, so the year-over-year inflation rates calculated between 2015 and 2014 are based on different methodologies for the HICP. For more information, please see Eurostat, Improved calculation of HICP special aggregates and German package holidays methodological change.
Source: Eurostat-News Release ANALYSIS OF NOVA SCOTIA'S CONSUMER PRICE INDEX FOR MARCH 2019
TRENDS - MARCH 2019
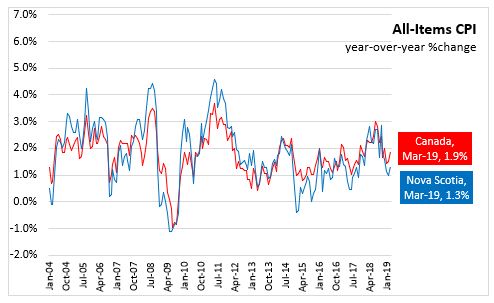
In Nova Scotia March 2019, year over year growth for the All-Items Consumer Price Index was 1.3 per cent, below the national average of 1.9 per cent. Monthly consumer prices were up 0.8 per cent in Nova Scotia while nationally there was an increase of 0.7 per cent.
Within Atlantic Canada, New Brunswick had the highest year over year consumer price inflation (+1.6 per cent), followed by Nova Scotia (+1.3 per cent), Newfoundland and Labrador (+1.2 per cent) and Prince Edward island (+1.0 per cent)
In March 2019, all provinces experienced positive month over month inflation of at least 0.5 per cent. Year over year inflation was higher than last month for all provinces with the highest inflation rate for March 2019 in British Columbia (+2.6 per cent).

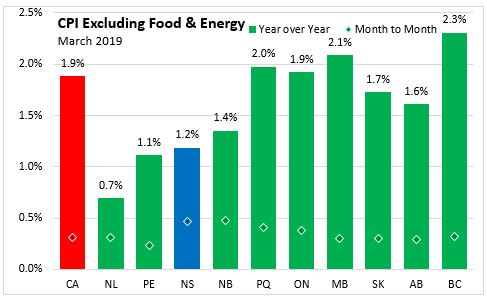
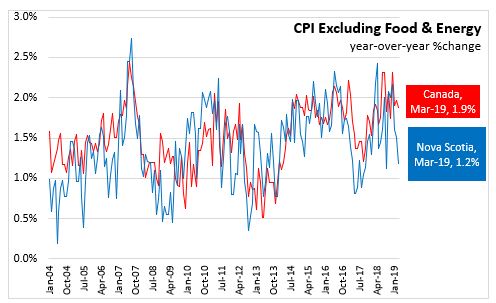
Nova Scotia's consumer price inflation (year over year growth in CPI) excluding food and energy rose 1.2 per cent in March, below the national rate of 1.9 per cent. Price level gains for this index were largest in British Columbia (+2.3 per cent), and lowest in Newfoundland and Labrador (+0.7 per cent). On a monthly basis, Nova Scotia's index excluding food and energy was up 0.5 per cent.
The main contributors to the monthly (March 2019 vs. February 2019) NS CPI movement:
- Gasoline (+12.8%)
- Recreational equipment and services (+8.1%)
- Telephone services (-2.0%)
- Personal care supplies and equipment(-2.5%)
The main contributors to the annual (March 2019 vs. March 2018) NS CPI movement:
- Purchase and leasing of passenger vehicles(+3.3%)
- Passenger vehicle insurance premiums (+9.0%)
- Traveller accommodation (-12.1%)
- Internet access services (-10.5%)
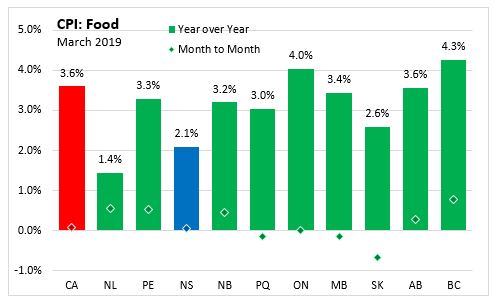
The CPI for food in Nova Scotia increased 2.1 per cent year-over-year with a 0.1 per cent increase month-to-month. CPI growth in food (year over year) was up in all provinces this month. British Columbia showed the highest year over year food price growth (+4.3%). Nationally, annual food prices increased 3.6 per cent with increases in fresh vegetables (+15.7%) and fresh fruit (8.6%).
The Nova Scotia energy index increased by 2.3 per cent compared to a year ago. Energy prices compared to February 2018 were up in all provinces by at least 4.0 per cent, rising 6.0 per cent nationally and 5.2 per cent in Nova Scotia . Year-over-year energy price indexes were up the most in Alberta (7.1 per cent) but were down in Ontario (-5.3 per cent). Nationally, the index was down 1.2 per cent year over year compared to a decline of 5.7 per cent last month as downward pressure from gasoline prices eased and prices for natural gas and fuel oil grew in March 2019.
Year over year, the consumer price index for shelter increased by 2.0 per cent in Nova Scotia and 2.7 per cent in Canada.
Major Components for March 2019
The following table shows the price increases specific to Nova Scotia for the major components of the CPI this month:
Long Run Trends
The All-Items CPI year over year inflation rate for Nova Scotia was below Canada's in March 2019. Nova Scotia's annual inflation has remained below the Canadian average since mid-2014, with the exception of only a few months. While month to month movements in the indices can be different, over time they generally follow the same overall trend.
Annual inflation for the CPI excluding food and energy was lower for Nova Scotia (at 1.2 per cent) compared to Canada in March.
Bank of Canada's preferred measures of core inflation
Compared with March 2018, CPI-Common increased 1.8 per cent, CPI-Median rose 2.0 per cent and CPI-Trim was up 2.0 per cent in Canada. All-items CPI excluding eight of the most volatile components as defined by the Bank of Canada and excluding the effect of changes in indirect taxes (formerly referred to as CPIX) rose 1.6 per cent year over year in March 2019.
Appendix Tables and Charts

A NOTE ON CONSUMER PRICE INDEX
On February 27, 2019, with the release of the January 2019 CPI, the basket of goods and services used in the calculation of the CPI was updated using 2017 weights. The base year, in which the CPI is set to equal 100, remains 2002.
The 2017 basket classification system was updated to add new, relevant goods and services, while removing some that are obsolete. Some minor changes will be made to published index titles in order to clarify the definition of some series.
The alcoholic beverages and tobacco products major component has been updated to include recreational cannabis. Additionally, medicinal cannabis has been added under medicinal and pharmaceutical products.
There is also a change to the calculation of the rent index. Month over month changes to the rent index will not be impacted as the previous month has been linked to the current month. However, year over year change calculations should be interpreted with caution, particularly in the year following this implemented change.
Source: Statistics Canada data portal: Tables 18-10-0004-01 and 18-10-0256-01
|