To view previous releases, select one from the dropdown box:
Currently displaying information released on: August, 2019
ANALYSIS OF NOVA SCOTIA'S CONSUMER PRICE INDEX FOR JULY 2019
TRENDS - July 2019
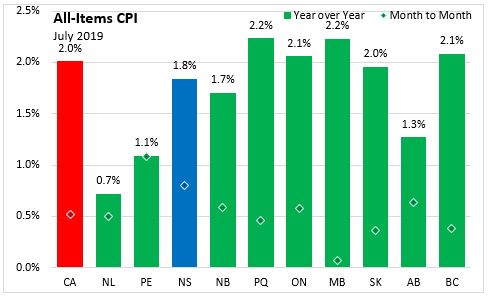
In Nova Scotia June 2019, year over year growth for the All-Items Consumer Price Index was 1.8 per cent, below the national average of 2.0 per cent. Monthly consumer prices were up 0.8 per cent in Nova Scotia and 0.5 per cent nationally.
Within Atlantic Canada, Nova Scotia had the highest year over year consumer price inflation (+1.8 per cent), followed by New Brunswick (+1.7 per cent). Inflation was lower in Newfoundland and Labrador (+0.7 per cent) and Prince Edward Island (+1.1 per cent).
The national CPI increase of 2.0 per cent on a year-over-year basis in July was the same as the previous month. Gasoline prices rose month over month, but remain below July 2018 levels. Energy prices were lower than one year ago with the CPI excluding energy rising 2.5 per cent year over year. Year over year inflation was higher than last month for four provinces, unchanged for two provinces and lower for four provinces. The highest inflation rate for July 2019 was in Manitoba (+2.2 per cent) and Quebec (+2.2 per cent). Annual inflation fell from 2.7 per cent in June with a decreased in its provincial retail sales tax from 8 per cent to 7 per cent on July 1.
Telephone service prices declined in July compared to June following a shift in pricing structure of cellular data plans amid intensifying competition among providers. The multipurpose digital device index, which includes prices for smartphones, was up as the introduction of unlimited data plans coincide with a reduction in subsidies on devices
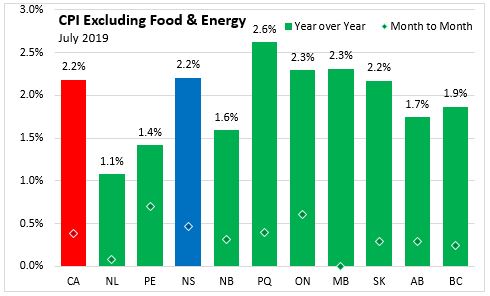
Nova Scotia's consumer price inflation (year over year growth in CPI) excluding food and energy rose 2.2 per cent in July, the same as the national rate of 2.2 per cent. Price level gains for this index were largest in Quebec (+2.6 per cent), and lowest in Newfoundland and Labrador (+1.1 per cent). On a monthly basis, Nova Scotia's index excluding food and energy was up 0.5 per cent.
The main contributors to the monthly (July 2019 vs. June 2019) NS CPI movement:
- Gasoline (+8.1 per cent)
- Inter-city transportation (+13.3 per cent)
- Purchase and leasing of passenger vehicles (-1.6 per cent)
- Telephone services (-3.0 per cent)
The main contributors to the annual (July 2019 vs. July 2018) NS CPI movement:
- Passenger vehicle insurance premium (+14.5 per cent)
- Purchase and leasing of passenger vehicles (+3.1 per cent)
- Gasoline (-4.9 per cent)
- Internet access service (-10.1 per cent)
The CPI for food in Nova Scotia increased 3.8 per cent year-over-year with a 1.2 per cent increase month-to-month. CPI growth in food (year over year) was up in all provinces this month. Alberta showed the highest year over year food price growth (+4.7 per cent). Nationally, annual food prices increased 3.8 per cent.

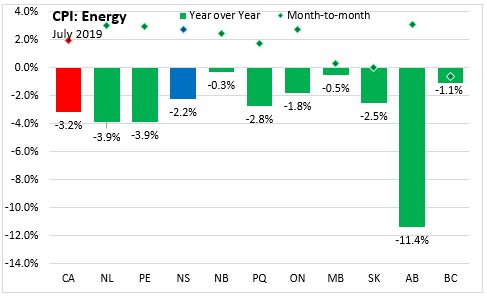
The Nova Scotia energy price index decreased by 2.2 per cent compared to a year ago. Monthly energy prices (July 2019 vs. June 2019) were up 2.7 per cent in Nova Scotia and 1.9 per cent nationally. Year-over-year energy price indexes were down the most in Alberta (-11.4 per cent) in part due to sustained oversupply of natural gas in commodity market.
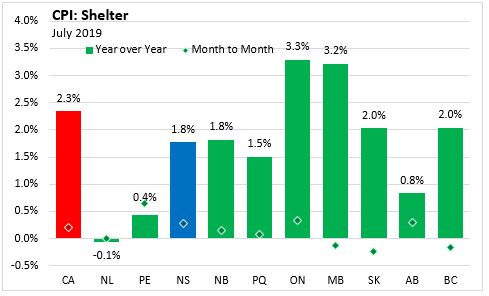
Year over year, the consumer price index for shelter increased by 1.8 per cent in Nova Scotia and 2.3 per cent in Canada.
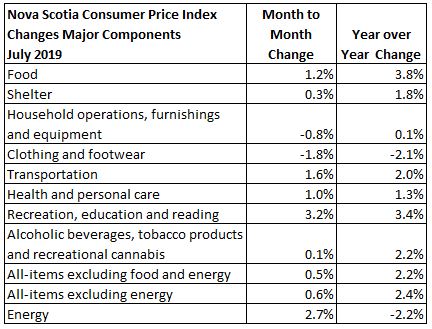
Major Components for July 2019
The following table shows the price increases specific to Nova Scotia for the major components of the CPI this month:
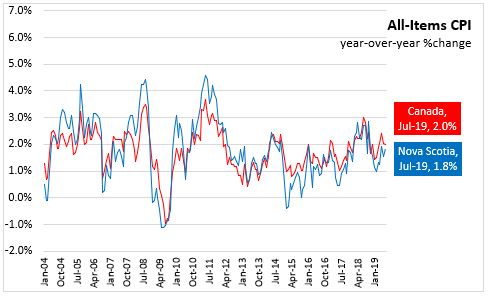
Long Run Trends
The All-Items CPI year over year inflation rate for Nova Scotia was below Canada's in July 2019. Nova Scotia's annual inflation has remained below the Canadian average since mid-2014, with the exception of only a few months. While month to month movements in the indices can be different, over time they generally follow the same overall trend.
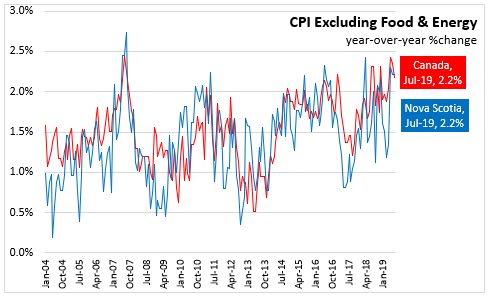
Annual inflation for the CPI excluding food and energy was the same for Nova Scotia (2.2 per cent) and Canada (2.2 per cent) in July.
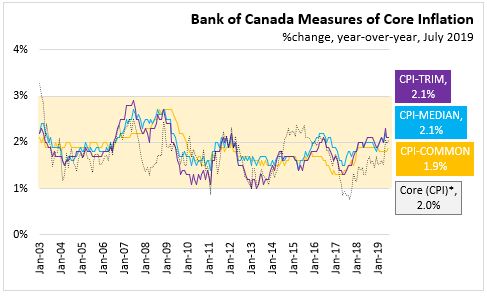
Bank of Canada's preferred measures of core inflation
Compared with July 2018, CPI-Common increased 1.9 per cent, CPI-Median rose 2.1 per cent and CPI-Trim was up 2.1 per cent in Canada. All-items CPI excluding eight of the most volatile components as defined by the Bank of Canada, and excluding the effect of changes in indirect taxes (formerly referred to as CPIX), rose 2.0 per cent year over year.
Appendix Tables and Charts

A NOTE ON CONSUMER PRICE INDEX
On February 27, 2019, with the release of the January 2019 CPI, the basket of goods and services used in the calculation of the CPI was updated using 2017 weights. The base year, in which the CPI is set to equal 100, remains 2002.
The 2017 basket classification system was updated to add new, relevant goods and services, while removing some that are obsolete. Some minor changes will be made to published index titles in order to clarify the definition of some series.
The alcoholic beverages and tobacco products major component has been updated to include recreational cannabis. Additionally, medicinal cannabis has been added under medicinal and pharmaceutical products.
There is also a change to the calculation of the rent index. Month over month changes to the rent index will not be impacted as the previous month has been linked to the current month. However, year over year change calculations should be interpreted with caution, particularly in the year following this implemented change.
Source: Statistics Canada data portal: Tables 18-10-0004-01 and 18-10-0256-01 CONSUMER PRICE INDEX, JULY 2019

NOVA SCOTIA
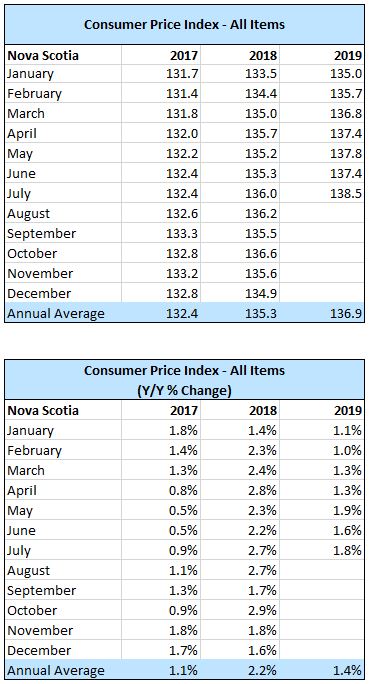
In Nova Scotia July 2019, the Consumer Price Index (index 2002=100) increased 0.8 per cent from June 2019 to 138.5 and increased 1.8 per cent over July 2018. The CPI, excluding food and energy, increased 0.5 per cent from June 2019 and increased 2.2 per cent over July 2018.
CANADA
In Canada July 2019, the Consumer Price Index (index 2002=100) increased 0.5 per cent from June 2019 to 137.0 and increased 2.0 per cent over July 2018. The CPI, excluding food and energy, increased 0.4 per cent from June 2019 and increased 2.2 per cent over July 2018.
In Canada July 2019, the key monetary policy indicators of inflation were:
- CPI-Common was 1.9 per cent,
- CPI-Median was 2.1 per cent and
- CPI-Trim was 2.1 per cent.
HALIFAX
In Halifax July 2019, the Consumer Price Index (index 2002=100) increased 0.7 per cent from June 2019 to 137.0 and increased 1.8 per cent over July 2018.
REFERENCES
Statistics Canada. Table 18-10-0004-01 Consumer Price Index, monthly, not seasonally adjusted
Statistics Canada. Table 18-10-0256-01 Consumer Price Index (CPI) statistics, measures of core inflation and other related statistics - Bank of Canada definitions EU AND EURO AREA CONSUMER PRICE INFLATION, JULY 2019

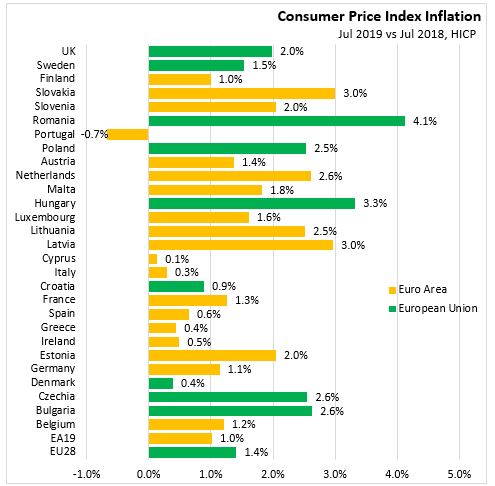
In July, the year-over-year inflation rate declined to 1.4 per cent in the European Union and to 1.0 per cent in the Euro Area.
Among member states, the fastest year-over-year inflation was reported in Romania and Hungary, while the lowest inflation was reported in Portugal, Cyprus, and Italy.
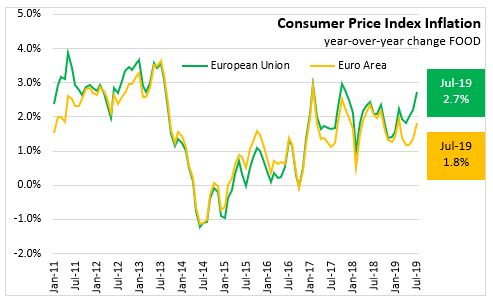
In July 2019 food price inflation rose to 2.7 per cent (year-over-year) in the European Union and to 1.8 per cent in the Euro Area.
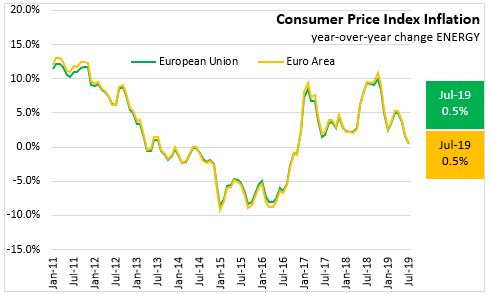
Energy inflation fell to 0.5 per cent year-over-year in the European Union, and to 0.5 per cent in the Euro Area.
Excluding the impacts of volatile energy, food, alcohol and tobacco prices, year-over-year inflation has been more subdued in Europe. In July 2019, the CPI excluding food, energy, alcohol and tobacco rose to 1.0 per cent for the European Union and to 0.9 per cent for the Euro Area.

Note, Methodological changes was made to data starting in 2015, so the year-over-year inflation rates calculated between 2015 and 2014 are based on different methodologies for the HICP.
Source: Eurostat-News Release
Statistics Canada. Table 18-10-0004-01 Consumer Price Index, monthly, not seasonally adjusted
|