To view previous releases, select one from the dropdown box:
Currently displaying information released on: July, 2026
CONSUMER PRICE INDEX, JUNE 2026
Year-over-year (June 2026 vs June 2025)
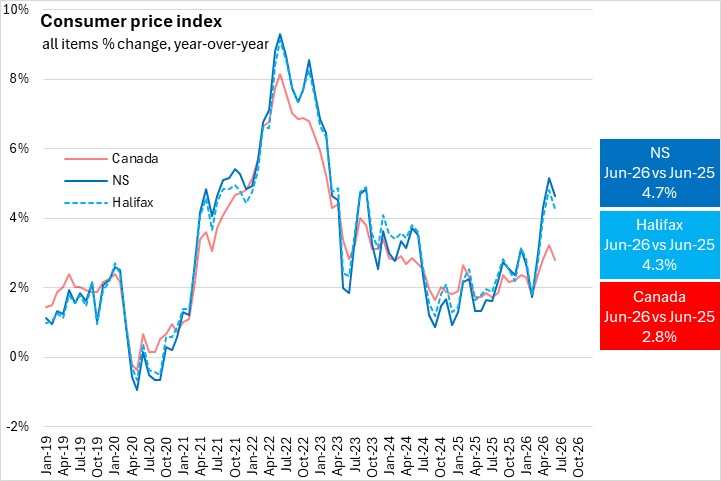
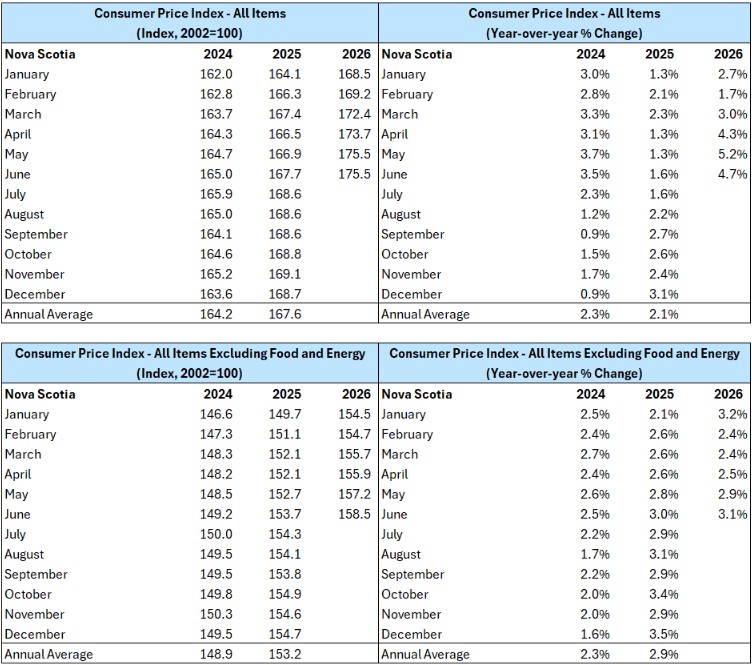
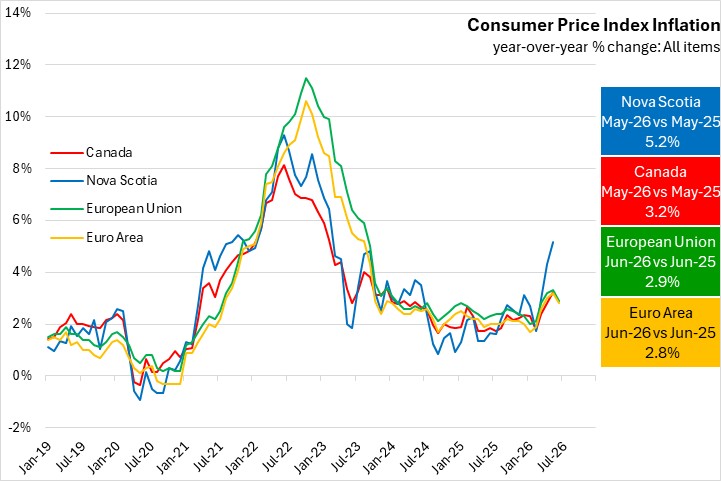
All items: Consumer prices in Nova Scotia increased 4.7%, down 0.5 percentage points from inflation in the previous month. The national average inflation was 2.8%. In Halifax consumer prices increased 4.3%.
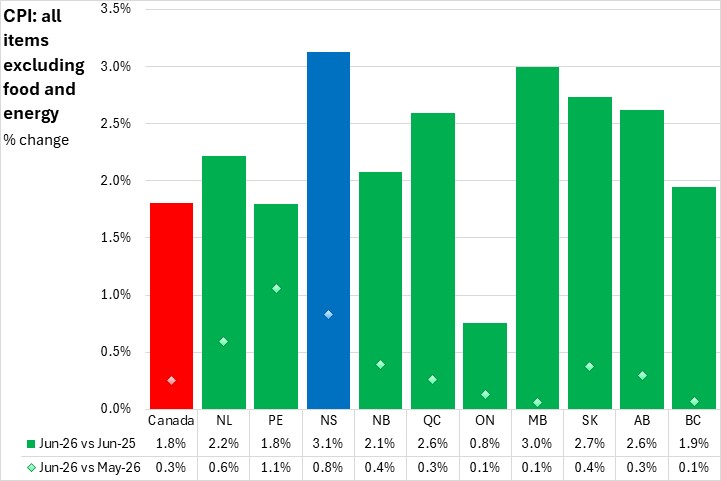
All items excluding food and energy: Nova Scotia consumer prices outside of food and energy increased 3.1%. This was above the national average increase of 1.8%.
Month-over-month (June 2026 vs May 2026)
All items: Consumer prices in Nova Scotia were unchanged in June 2026 compared with May 2026. Nationally, consumer prices were down 0.4% compared to the previous month. In Halifax consumer prices were down 0.1%.
All items excluding food and energy: Nova Scotia consumer prices excluding food and energy were up 0.8% month over month in June 2026. Nationally, consumer prices outside of food and energy were also up 0.3% compared to May 2026.
Source: Statistics Canada. Table 18-10-0004-01 Consumer Price Index, monthly, not seasonally adjusted ANALYSIS OF CONSUMER PRICE INDEX FOR JUNE 2026
Note that energy prices continue to reflect the impact of the conflict in the Middle East.
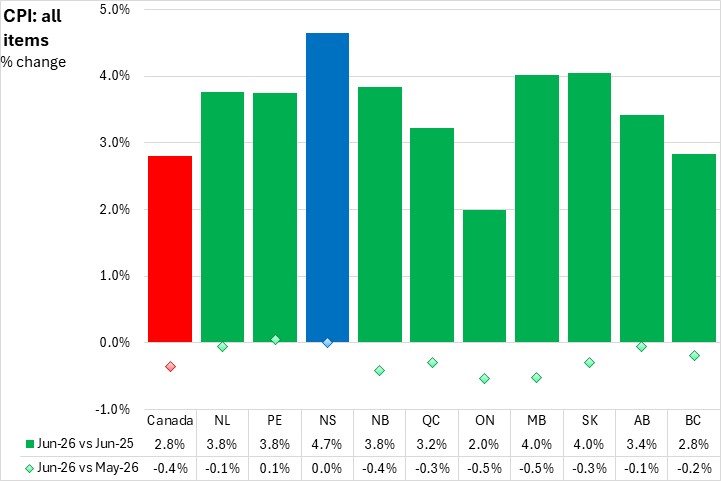
Nova Scotia’s all items Consumer Price Index (CPI) grew 4.7% year-over-year in June 2026, down 0.5 percentage points from the previous month.
Nationally, consumer prices grew 2.8% year-over-year in June 2026, down 0.4 percentage points from the previous month. Inflation was fastest in Nova Scotia and slowest in Ontario.
The most significant upward contributors (combining price increase as well as share of the consumption basket) to Nova Scotia's 4.7% year-over-year inflation were: gasoline, fuel oil and other fuels, rent, traveller accommodation, and food purchased from restaurants.
The largest downward year-over-year contributions were from: furniture, financial services, electricity, pet food and supplies, and non-electric kitchen utensils, tableware and cookware.
On a monthly basis, Nova Scotia's all items CPI was unchanged from May 2026 to June 2026. National prices were down 0.4% on average. The fastest rate of monthly increase was in Prince Edward Island, with the fastest decline in Ontario and Manitoba.
Major upward contributors to Nova Scotia's monthly consumer prices were: traveller accommodation, inter-city transportation, passenger vehicle insurance premiums, seeds, plants and cut flowers, and food purchased from restaurants. Major downward contributors were: gasoline, fuel oil and other fuels, rent, purchase and operation of recreational vehicles, and fresh vegetables.
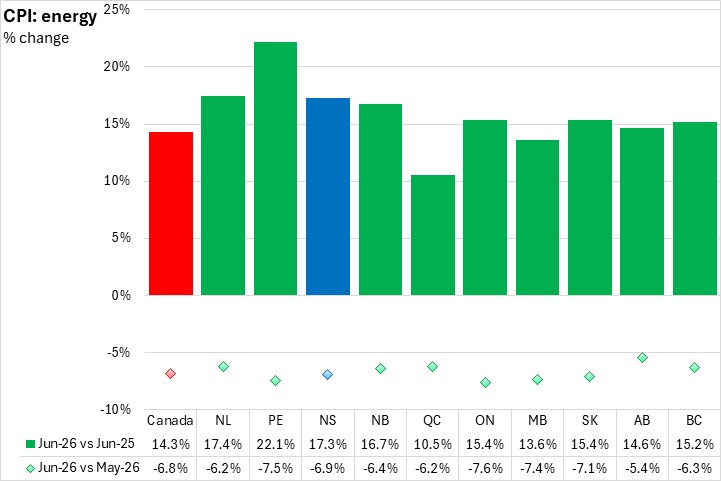
Energy prices play a significant role in inflation rates. Nova Scotia's energy prices (and overall inflation) are more sensitive to fluctuations in the global price of crude oil. Nova Scotia's energy prices were up 17.3% from June 2025 to June 2026. Year-over-year energy prices were up 14.3% nationally with all provinces reporting increasing energy prices (fastest: Prince Edward Island, slowest: Québec).
On a monthly basis, Nova Scotia's energy prices were down 6.9% from May 2026 to June 2026. National energy prices were down 6.8% with every province reporting lower prices compared to the previous month, led by Ontario.
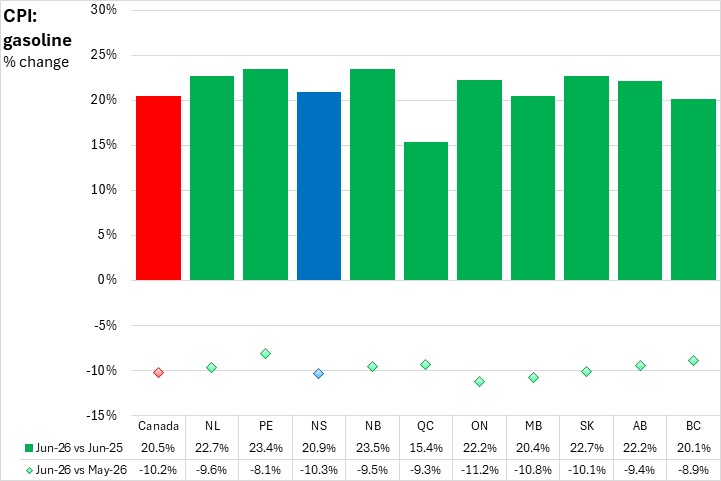
In June 2026, gasoline prices were up 20.9% compared to a year ago in Nova Scotia, more than the national average increase of 20.5%. All provinces reported increases, with New Brunswick reporting largest increase in gas prices year-over-year, and Québec the slowest.
Gasoline prices were down 10.3% from May to June in Nova Scotia. Nationally gasoline prices were down 10.2% with all provinces reporting lower prices, led by Ontario. Prince Edward Island reported the slowest monthly decline in gasoline prices.
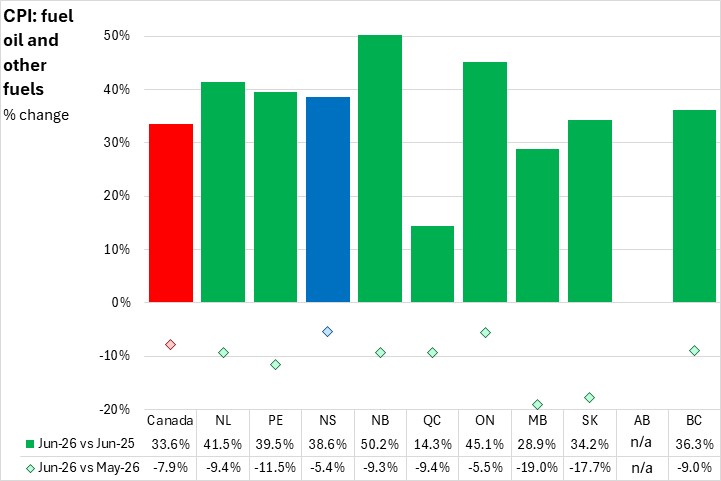
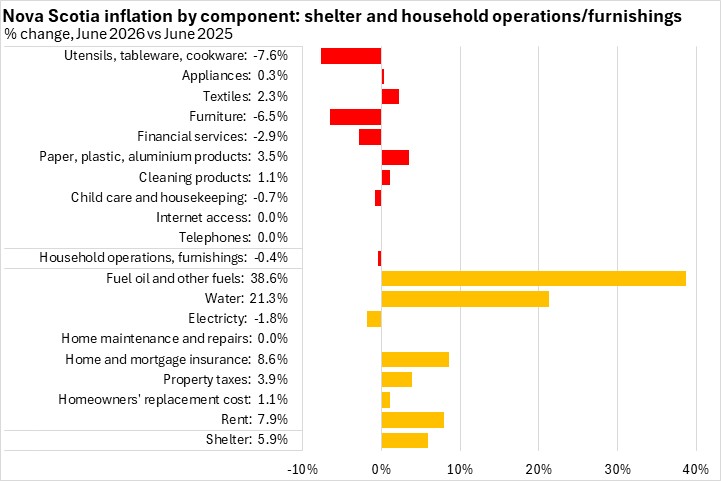
Nova Scotia's year-over-year fuel oil prices were up 38.6% in June 2026 compared with June 2025. Nationally, the fuel oil and other fuels price index increased 33.6% compared to June 2025 with all provinces, led by New Brunswick, reporting increases.
On a monthly basis, Nova Scotia's fuel oil prices were down 5.4% compared to May 2026. National fuel oil prices were down 7.9% from May to June, with decreases in every province, with Manitoba reporting the fastest monthly decrease, and Nova Scotia the slowest monthly decrease.
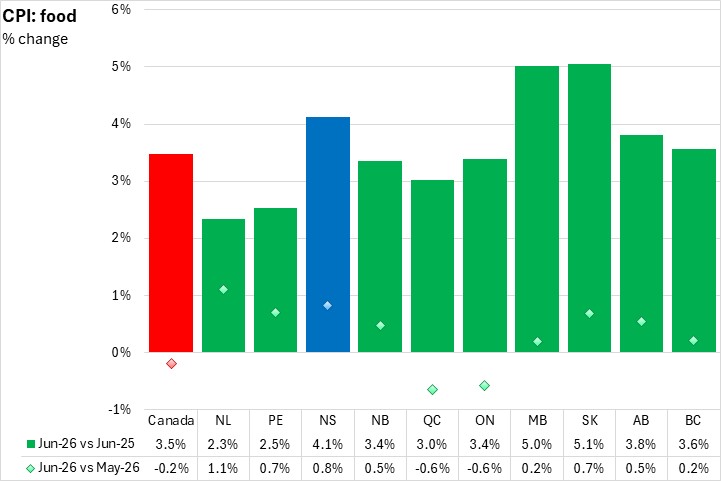
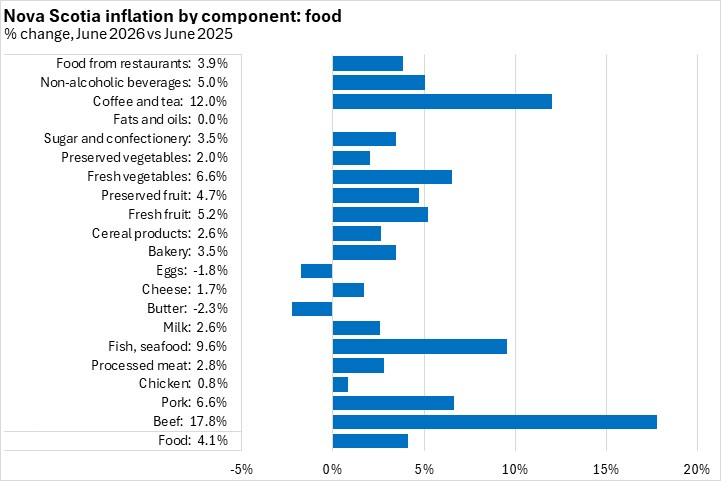
Food prices increased 4.1% in Nova Scotia year-over-year, above the national average food price inflation of 3.5% in June 2026. Food prices were up in every province, led by Saskatchewan and Manitoba.
On a monthly basis, Nova Scotia's food prices rose 0.8% from May to June. National food prices were down 0.2% with growth in every province except Québec and Ontario. Newfoundland and Labrador reported the largest monthly increase in food prices.
Food and energy prices are heavily influenced by volatile global commodity markets. Nova Scotia's underlying inflation rate excluding food and energy was 3.1% from June 2025 to June 2026, the fastest increase among provinces. Nationally, inflation excluding food and energy was 1.8% with year-over-year increases in all provinces. Ontario reported the slowest growth.
On a monthly basis, Nova Scotia's prices for all items excluding food and energy were up 0.8% from May to June. Nationally, prices for all items excluding food and energy were up 0.3% with every province reporting increases led by Prince Edward Island. The slowest rate of inflation excluding food and energy prices was in Ontario, Manitoba, and British Columbia.
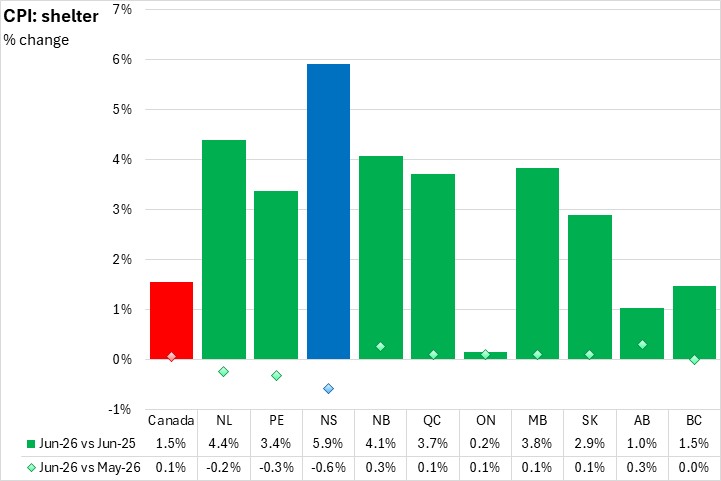
Year-over-year shelter cost inflation was 5.9% in Nova Scotia in June 2026. National shelter prices were up 1.5% with increases in all provinces. Nova Scotia had the fastest increase in shelter prices, while Ontario reported the slowest increase.
Monthly shelter costs were down 0.6% in Nova Scotia from May to June, the fastest decline among provinces. Nationally, shelter costs were up 0.1% with three provinces reporting declines. New Brunswick and Alberta had the fastest monthly increase in shelter prices.
Among detailed food products with available data, Nova Scotia's year-over-year inflation was fastest for beef and coffee/tea. Year-over-year price declines were reported for butter and eggs, with no change for fats/oils.
In detailed shelter cost components, the fastest year-over-year growth was for reported for fuel oil/other fuels and water.
Household operations/furnishings costs were down 0.4% overall. The largest year-over-year price increase was for paper/plastic/aluminum products, while prices fell the most for utensils/tableware/cookware and furniture.
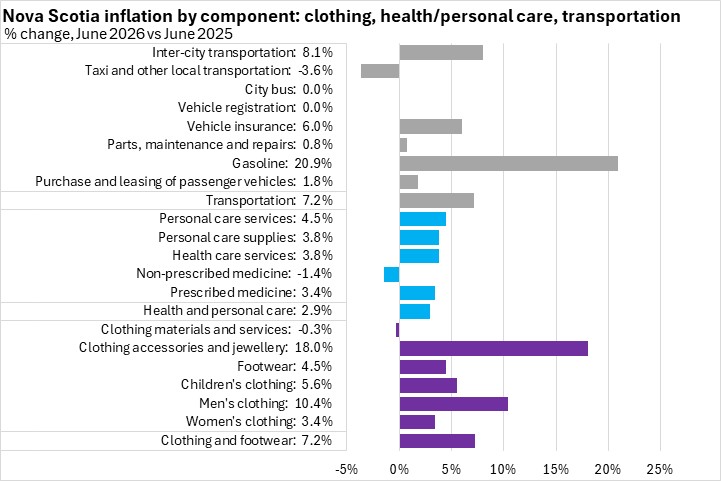
Clothing and footwear prices were up 7.2% year-over-year in June as all sub-components grew except for clothing materials/services, with the fastest price growth in clothing accessories/jewellery.
Health and personal care costs were up 2.9% year-over-year on gains in all sub-components except non-prescribed medicine. Personal care services reported the largest price increase.
Overall transportation costs were up 7.2% year-over-year in June due in large part to an increase in gasoline prices. The only decrease was in taxis/other local transportation, while city bus and vehicle registration prices were unchanged.
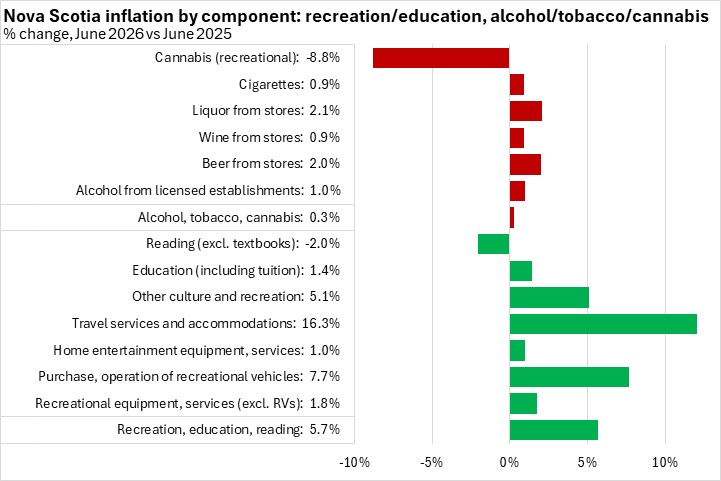
Nova Scotia's overall prices for recreation, education and reading were up 5.7% from June 2025 to June 2026 with the fastest increase for travel services/accommodations. The only decline was in reading (excluding textbooks).
Nova Scotia's prices for alcohol, tobacco and recreational cannabis were up 0.3% year-over-year. The largest increase was in liquor and beer from stores, while there was a large decrease in the price of cannabis.
Trends
Since the start of the Bank of Canada's inflation-targeting monetary policy regime, inflation for all items has generally been in the 0-4% range. Periods of above target inflation are typically followed by periods of slow price growth or declines. The acceleration in inflation from 2021 to 2024 was the strongest since the inflation-targeting era began, though this receded with tighter monetary policy and lower commodity prices. Nova Scotia's May 2026 all-items inflation rate of 5.2% was the fastest pace of year-over-year inflation since February 2023.
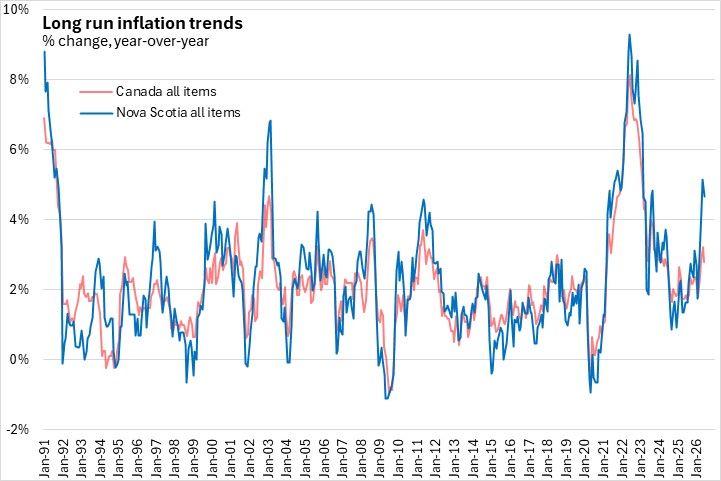
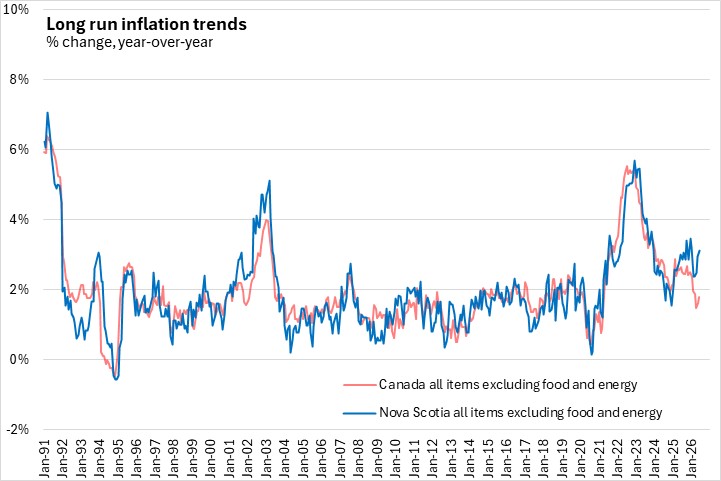
Many of these periods of accelerated and slowed inflation are attributable to volatile commodity prices, especially energy prices. Once the more volatile commodity prices are excluded, inflation in Nova Scotia has largely been below 2% for much of the last 20 years. However, the rise in inflation through 2021-2024 spread beyond commodity prices, resulting in the longest period under the Bank of Canada's inflation-targeting regime with Nova Scotia's CPI excluding food and energy above 3%. After decelerating in 2024, Nova Scotia's CPI excluding food and energy rose in 2025 and has remained above 2%.
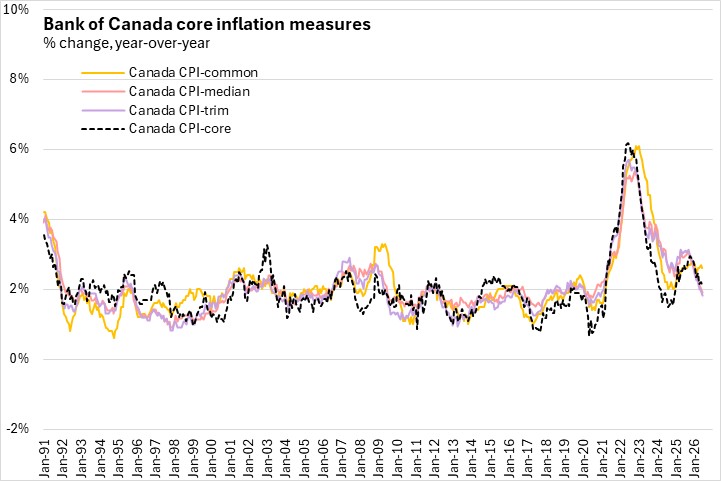
The Bank of Canada examines 'core' measures of inflation that are intended to remove the effects of volatile components and capture underlying inflation trends that are more connected to capacity in the Canadian economy. Core measures of inflation August also indicate where all items inflation is headed.
Canada's core measures of inflation remained mostly at or below the Bank's target of 2% for over a decade prior to 2021. However, core inflation measures rose in 2022, peaking at over 6% for the CPI-common measure before declining around the beginning of 2023. Core measures of inflation began to rise toward the end of 2024.
The Bank of Canada's year-over-year core inflation measures in June 2026 were:
- CPI-common: 2.6% (up from 2.7% the previous month)
- CPI-median: 1.9% (down from 2.1% the previous month)
- CPI-trim: 1.8% (down from 2.0% the previous month)
The core CPI excluding volatile products and the effects of indirect taxes was 2.1% (down from 2.2% the previous month).
Source: Statistics Canada. Table 18-10-0004-01 Consumer Price Index, monthly, not seasonally adjusted; Table 18-10-0256-01 Consumer Price Index (CPI) statistics, measures of core inflation and other related statistics - Bank of Canada definitions EU AND EURO AREA CONSUMER PRICE INDEX, JUNE 2026
Year-over-year (June 2026 vs June 2025)
The inflation rate slowed to 2.9% in the European Union and to 2.8% in the Euro Area in June 2026.
The fastest inflation was reported in Romania, while the slowest inflation rate was in Sweden.
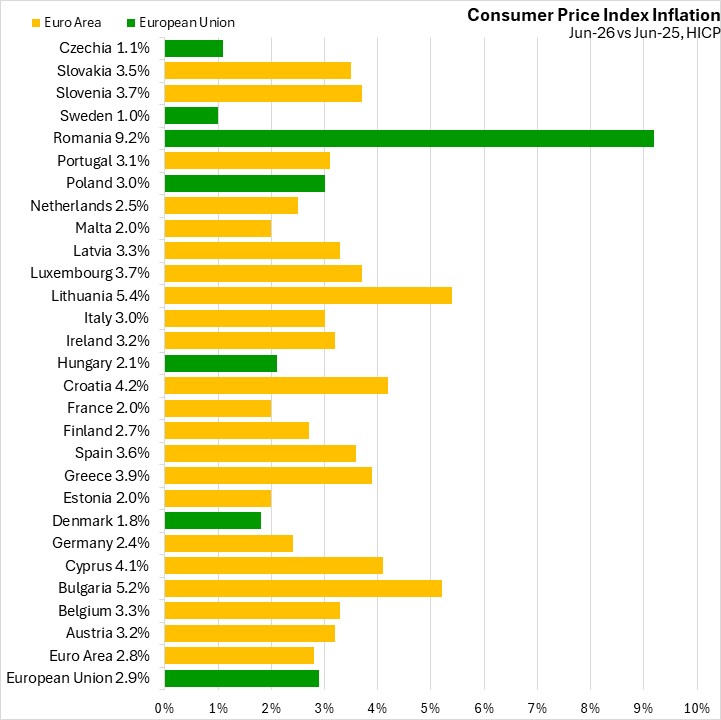
Note that from 1 January 2026, the Euro Area also includes Bulgaria.
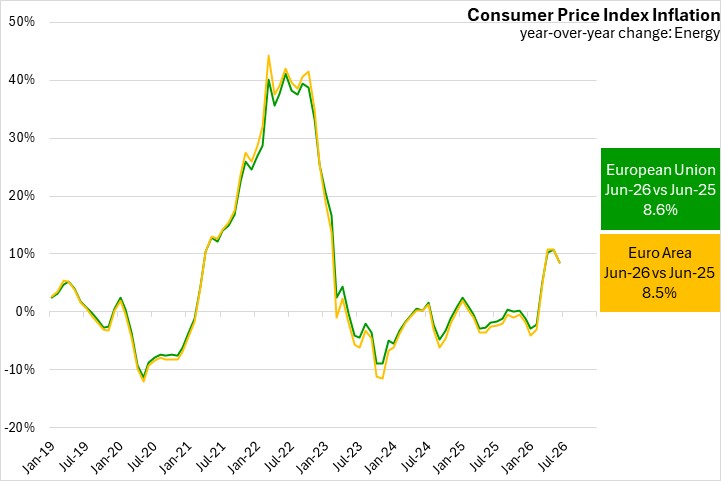
Energy price inflation was 8.6% in the European Union and 8.5% in the Euro Area in June 2026.
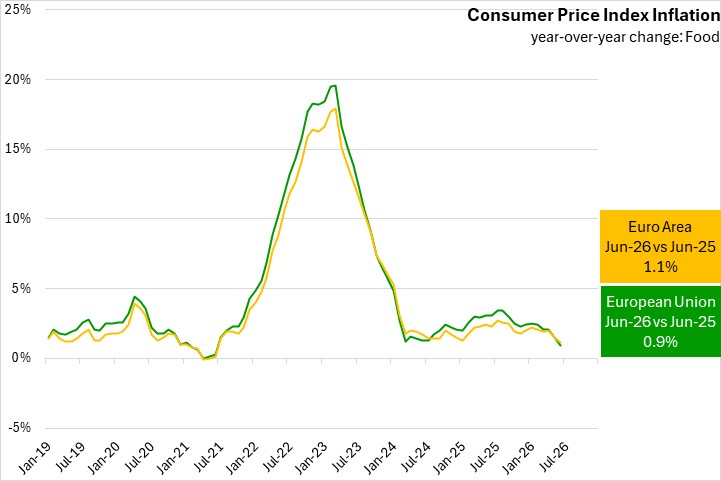
Food price inflation was 0.9% for the European Union and 1.1% in the Euro Area in June 2026.
Excluding the impacts of energy, food, alcohol and tobacco prices year-over-year inflation was 2.6% in the European Union and 2.4% in the Euro Area in June 2026.
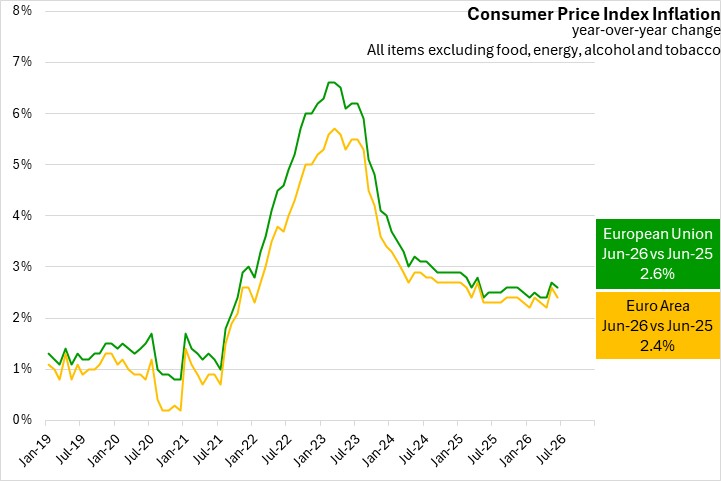
Note: annual data shown for the 27 countries that currently make up the European Union and for the 21 countries that currently use the Euro as their currency.
Source: Eurostat; Eurostat Data US CONSUMER PRICE INDEX, JUNE 2026
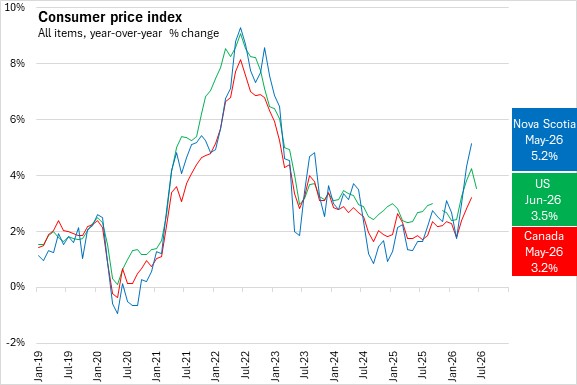
The United States Consumer Price Index (not seasonally adjusted) for All Urban Consumers increased 3.5% year-over-year in June 2026, down from the 4.2% year-over-year pace in May 2026.
Compared to June 2025, the US energy price index was up 15.7%. The gasoline price index was up 26.7% year-over-year. The food index rose 3.0% and the shelter index was up 3.3% year-over-year.
The US CPI excluding food and energy rose 2.6% compared to June 2025.
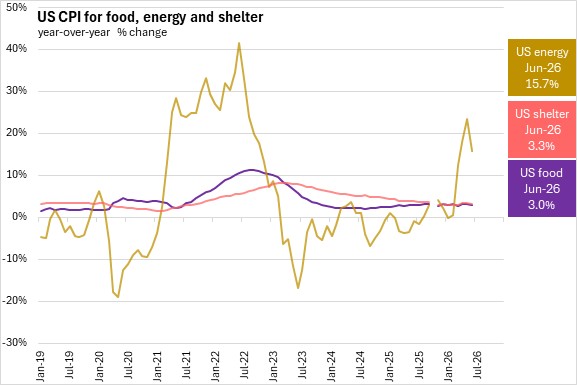
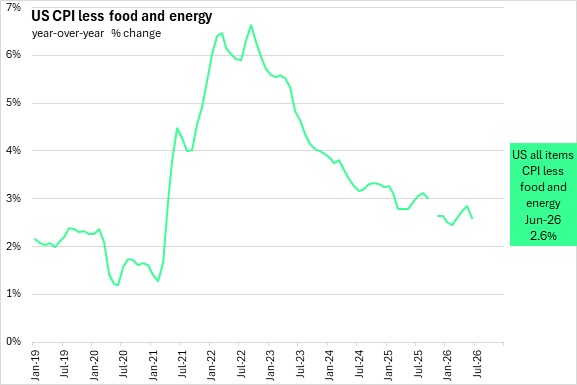
Please note that October 2025 CPI was not published due to the US government shut down.
CPI figures for Canada and Nova Scotia will be released on July 20, 2026.
Sources: Statistics Canada. Table 18-10-0004-01 Consumer Price Index, monthly, not seasonally adjusted; U.S. Bureau of Labour Statistics retrieved from the Federal Reserve Bank of St. Louis AVERAGE RETAIL PRICES, MAY 2026
Year-over-year (May 2026 vs May 2025)
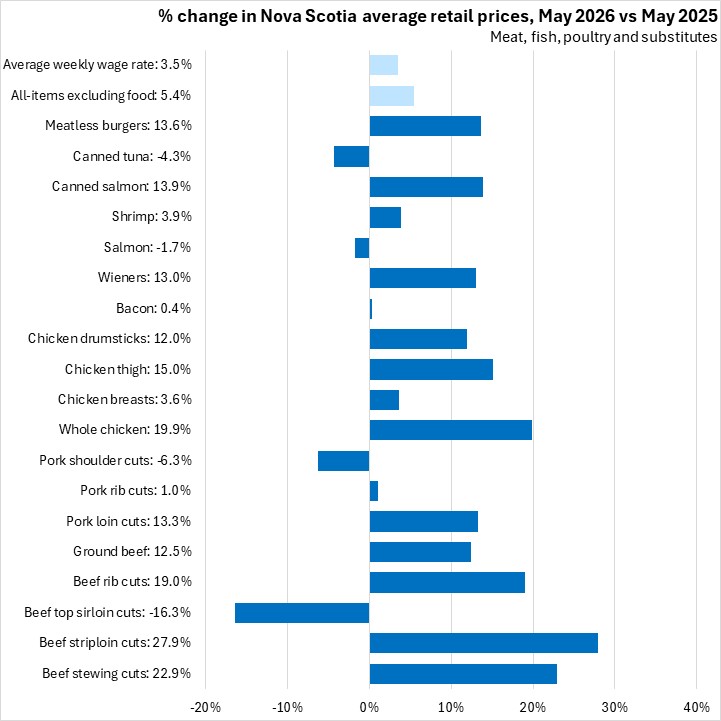
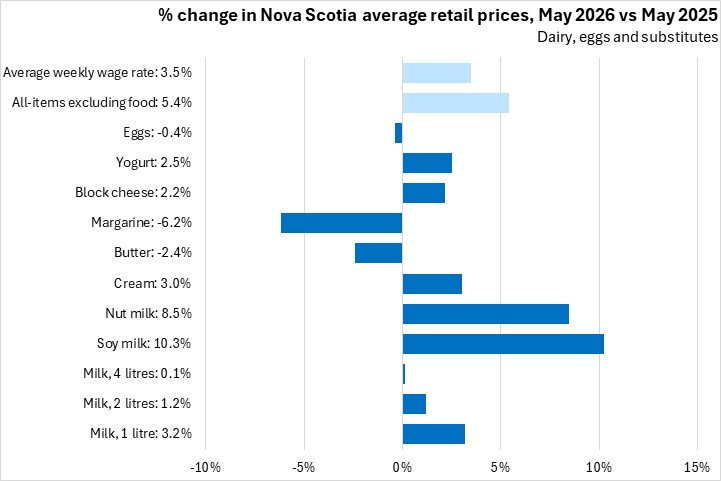
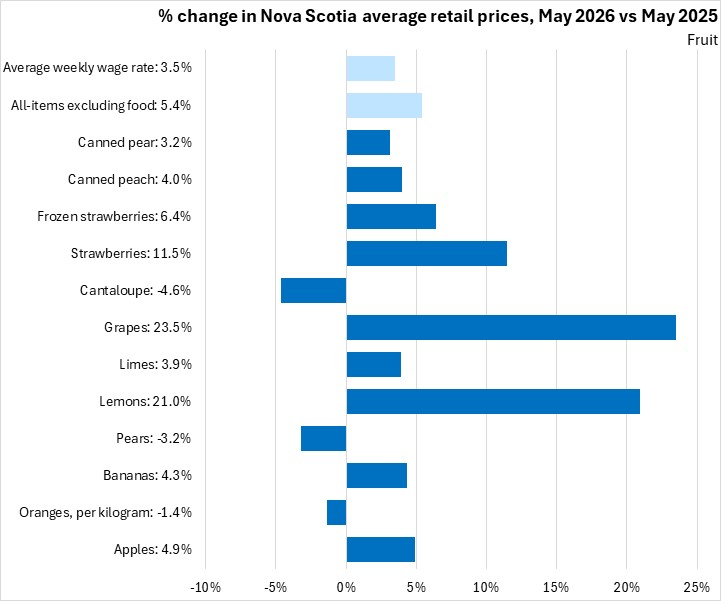
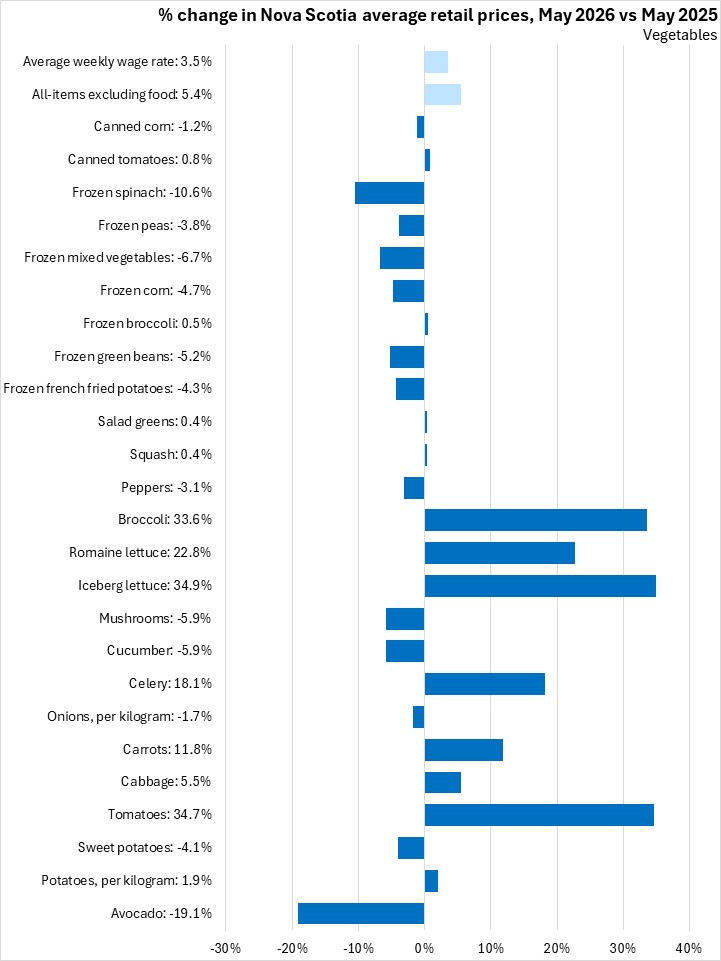
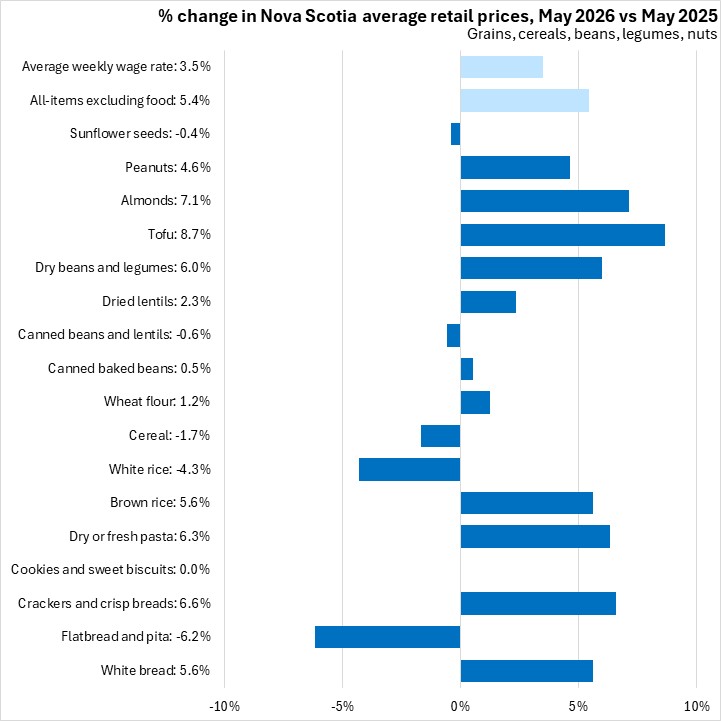
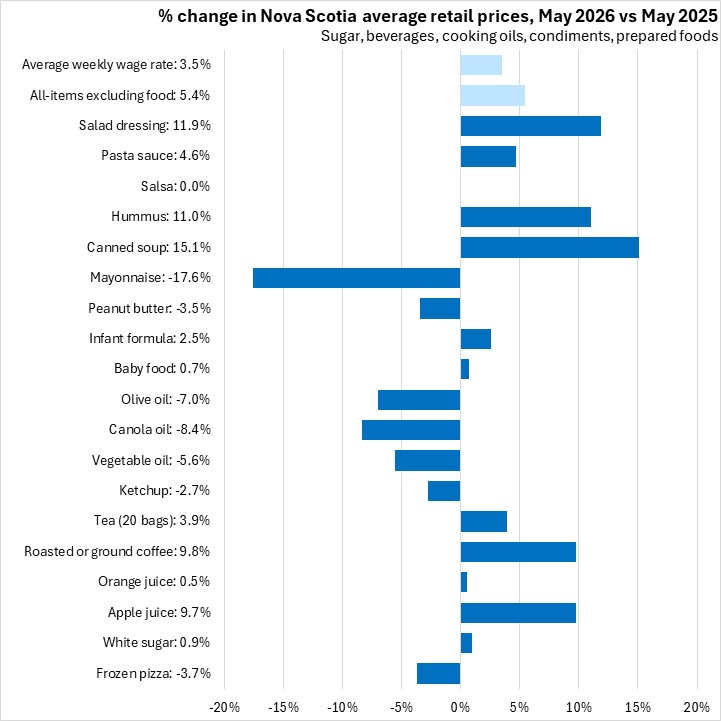
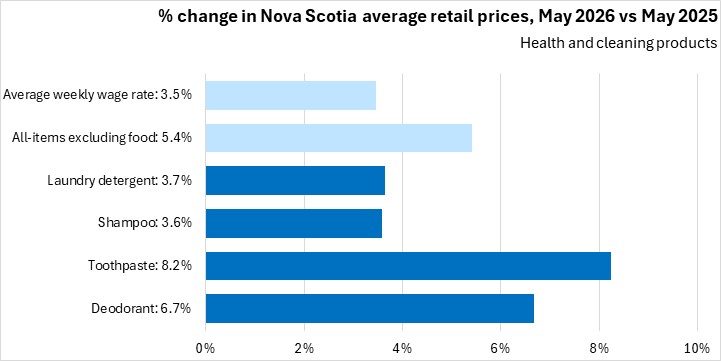
Over the last year (May 2026 vs May 2025), the consumer price index for all items in Nova Scotia excluding food increased by 5.4%. Food prices as a whole rose 3.3%. At the same time average weekly earnings across all Nova Scotia industries increased by 3.5%.
In the last year, the following products reported lower prices in Nova Scotia: beef top sirloin cuts, pork shoulder cuts, salmon, canned tuna, butter, margarine, eggs, oranges, pears, cantaloupe, avocado, sweet potatoes, onions, cucumber, mushrooms, peppers, frozen french fried potatoes, frozen green beans, frozen corn, frozen mixed vegetables, frozen peas, frozen pizza, frozen spinach, flatbread and pita, white rice, cereal, ketchup, vegetable oil, canola oil, olive oil, peanut butter, mayonnaise, canned beans and lentils, canned corn, and sunflower seeds.
The following products reported price growth that exceeded the gains in average weekly earnings: beef (stewing cuts, striploin cuts, rib cuts, ground), pork loin cuts, chicken(whole, breasts, thighs, drumsticks), wieners, shrimp, canned salmon, meatless burgers, soy milk, nut milk, apples, bananas, lemons, limes, grapes, strawberries, tomatoes, cabbage, carrots, celery, iceberg lettuce, romaine lettuce, broccoli, frozen strawberries, white bread, crackers and crisp breads, dry or fresh pasta, brown rice, apple juice, roasted or ground coffee, tea, canned soup, canned peach, dry beans and legumes, tofu, hummus, pasta sauce, salad dressing, almonds, peanuts, deodorant, toothpaste, shampoo and laundry detergent.
Nova Scotia prices relative to national average (May 2026)
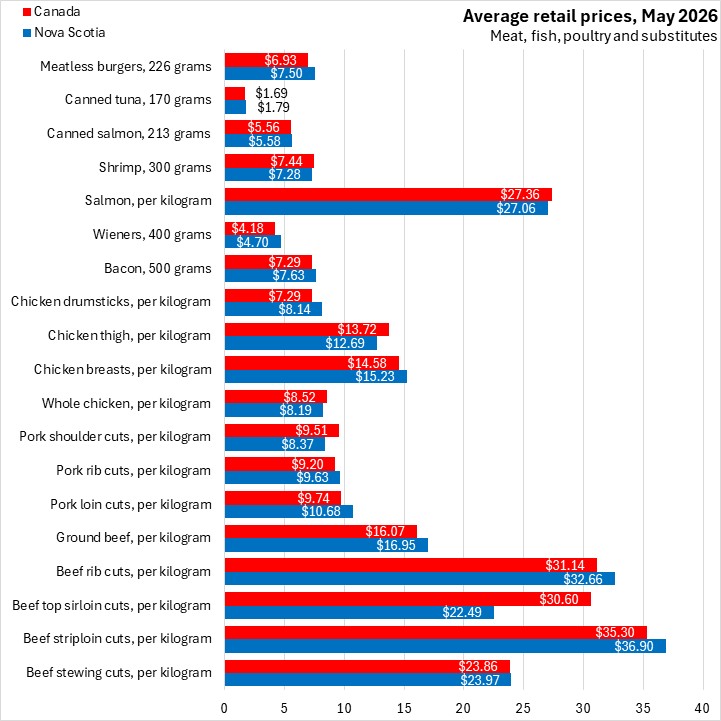
Nova Scotia food prices were below national averages for the following products: beef top sirloin cuts, pork shoulder cuts, whole chicken, chicken thigh, salmon, shrimp, milk (2 litres), strawberries, frozen mixed vegetables, frozen spinach, peanut butter, mayonnaise, canned corn, tofu, pasta sauce and almonds.
Nova Scotia food prices were more than 10% higher than the national averages for the following products: chicken drumsticks, wieners, cream, eggs, apples, oranges, bananas, pears, lemons, limes, grapes, cantaloupe, potatoes, sweet potatoes, tomatoes, cucumber, mushrooms, iceberg lettuce, broccoli, peppers, flatbread and pita, crackers and crisp breads, vegetable oil, canola oil, canned tomatoes, canned soup and dried lentils.
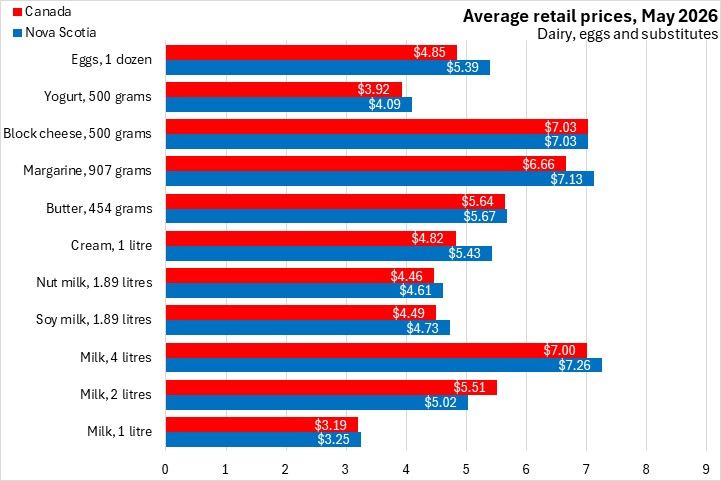
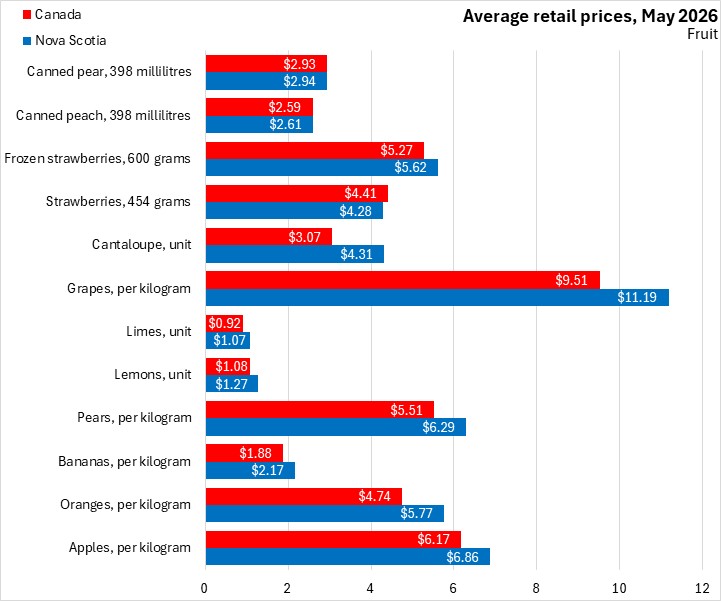
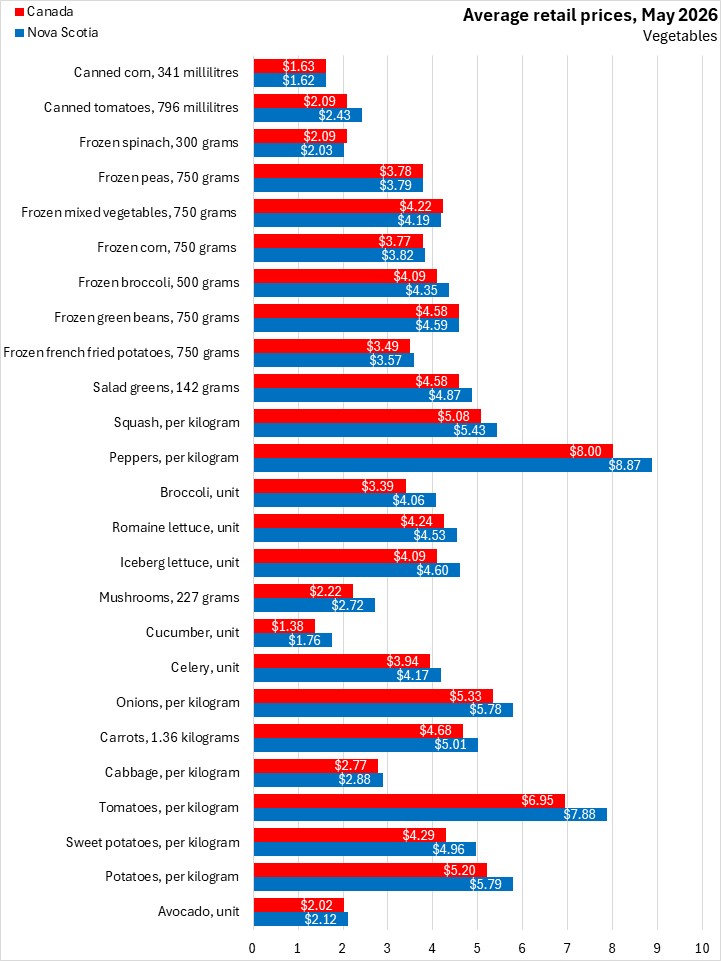
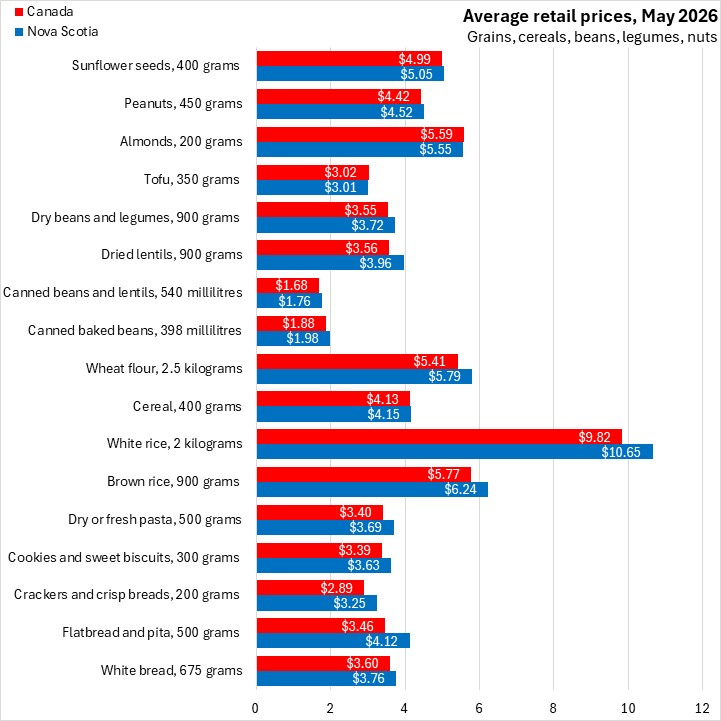
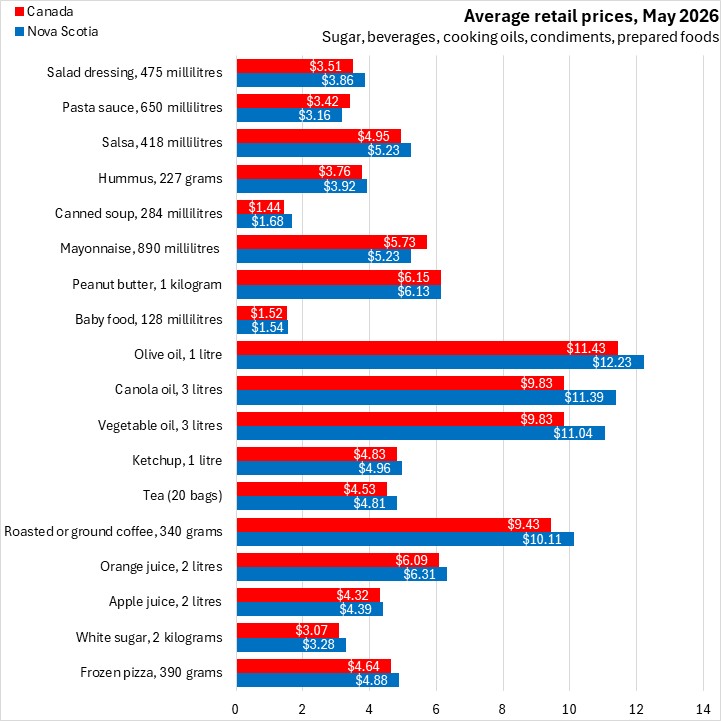

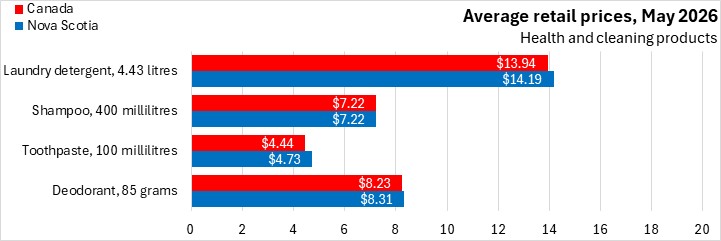
Notes: Statistics Canada makes available scanner data on prices collected for a range of food and personal care items. These prices are collected through point-of-sale (transaction) data obtained directly from Canadian retailers. The data represent commonly purchased items (which do change over time), but are not representative of the Consumer Price Index weights. Over time, products are rotated and quantity or quality may change. Comparisons of prices from one time period to another reflect quantity and quality changes as well as price changes.
For the purposes of this analysis, the 110 items reported by Statistics Canada will be grouped into:
- Meat, fish, poultry and meat substitutes
- Dairy, eggs and substitute products
- Fruit (including canned and frozen products)
- Vegetables (including canned and frozen products)
- Grains, cereals, beans, legumes and nuts
- Sugar, juices, cooking oils, condiments and prepared foods
- Health and cleaning products
Source: Statistics Canada. Table 18-10-0245-01 Monthly average retail prices for selected products; Table 18-10-0004-01 Consumer Price Index, monthly, not seasonally adjusted; Table 14-10-0063-01 Employee wages by industry, monthly, unadjusted for seasonality
|