To view previous releases, select one from the dropdown box:
Currently displaying information released on: April, 2024
BUSINESS OPENING AND CLOSING, JANUARY 2024
Monthly (January 2024 vs December 2023, seasonally adjusted)
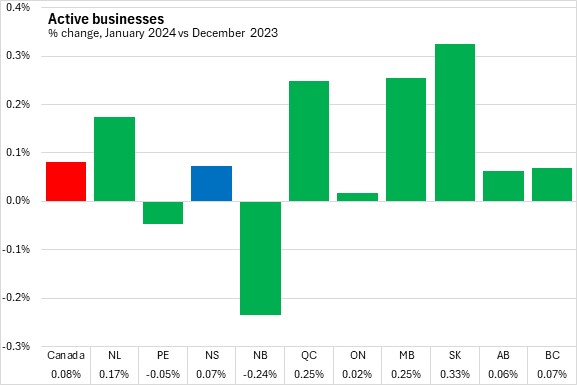
The number of active businesses in Nova Scotia grew 0.07% from December 2023 to January 2024 (going up to 20,736 active businesses).
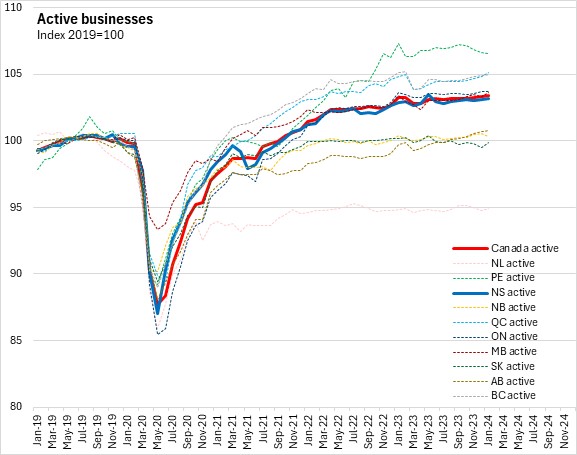
Nationally, active businesses were up by 0.08%. Most provinces reported higher numbers of active businesses in January 2024 compared with December 2023. The largest growth was reported in Saskatchewan. The only declines were reported in Prince Edward Island and New Brunswick.
A business will be classified as 'opening' if it had no employment in the previous month and then has employment in the next month. A business is 'closing' if it had employment in the previous month and no employment in the current month. For opening and closing, the reason could be a permanent change (i.e. business exit) or temporary for reasons such as seasonal operations, capital maintenance or restructuring. Continuing business are those that had employment in both the current and previous month. Active businesses are the sum of continuing and opening business in the current month.
The rate at which business either opened, continued or closed can be examined to see how the number of active businesses has changed. The calculation for the opening, continuing and closure rates are based on the number of active businesses in the previous month.
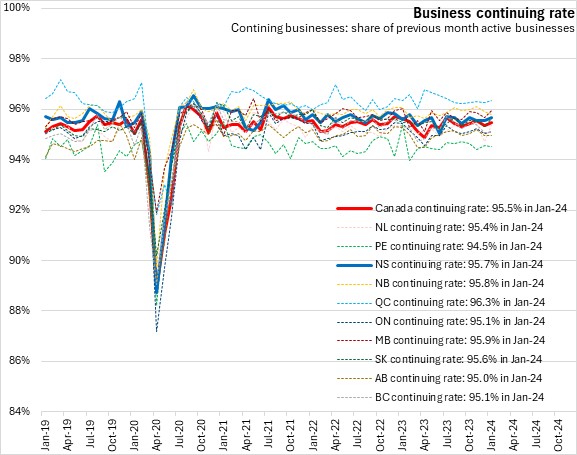
Most businesses continue operating each month. In January 2024, Nova Scotia's business continuing rate was 95.7%, similar to the national average of 95.5%. Québec reported the highest business continuing rate (96.3%) while Prince Edwar Island (94.5%) reported the lowest.
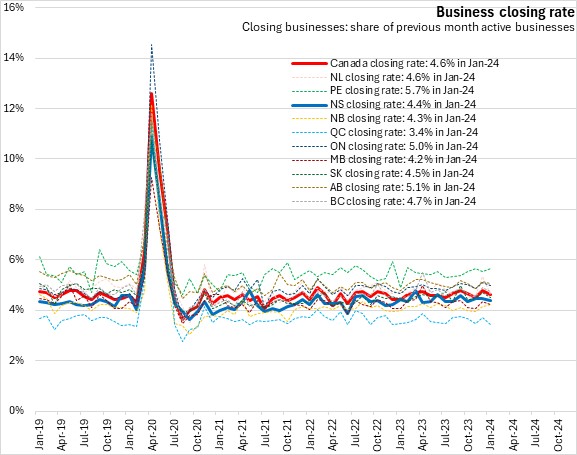
Nova Scotia's business opening rate was 4.4% in January 2024 (4.6% nationally). Prince Edward Island had the highest business opening rate (5.4%) while Quebec had the lowest (3.6%).

Nova Scotia's business closing rate was 4.4% in January 2024 (4.6% nationally). Prince Edwar Island reported the highest business closing rate (5.7%) while Québec had the lowest business closing rate (3.4%).
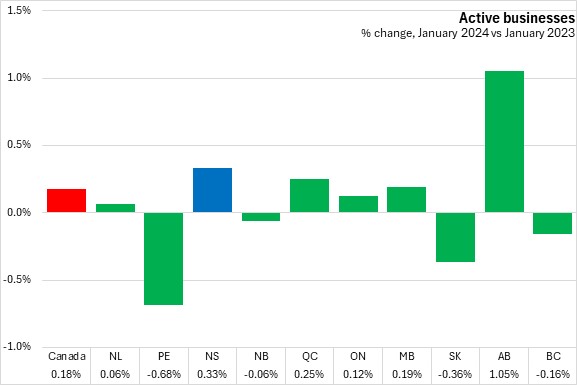
Year-over-year (January 2024 vs January 2023)
Compared with January 2023, the number of active businesses was up 0.33% for Nova Scotia, second only to Alberta. Nationally, active businesses were 0.18% higher than in January 2023. Prince Edward Island reported the largest year-over-year declines in active businesses.
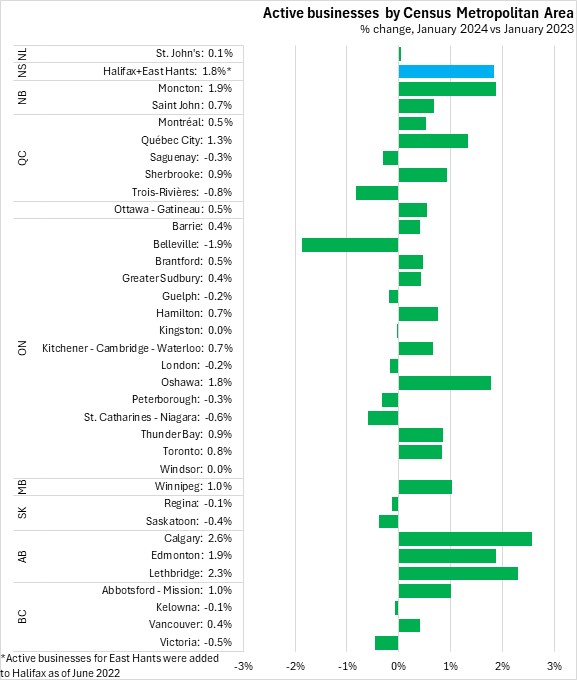
The number of active businesses in the Halifax and East Hants Census Metropolitan Area was up 1.8% from January 2023 to January 2024.
Out of 35 CMAs, 22 reported growth in active businesses over the past 12 months. Calgary and Lethbridge reported the largest rises in the number of active businesses while Belleville reported the biggest decline.
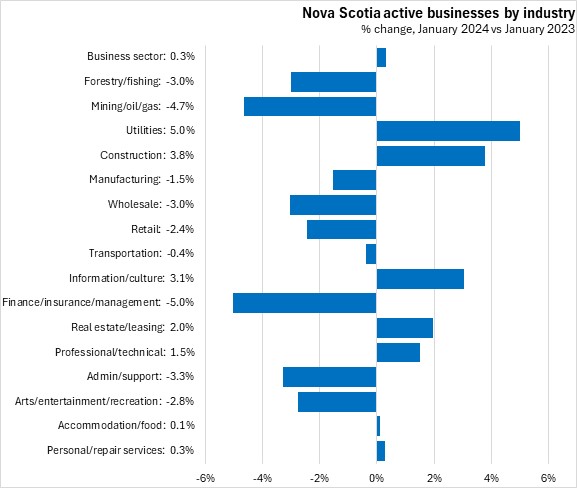
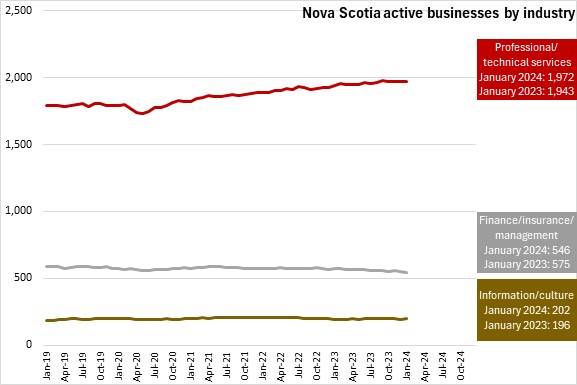
Compared with January 2023, the number of active Nova Scotia businesses in January 2024 was lower in most business sector industries, led by forestry/fishing, mining/oil/gas, wholesale, retail, finance/insurance/management, administration/support, and arts/entertainment/recreation. From January 2023 to January 2024, there were increases in the number of active businesses in utilities, construction, information/culture, real estate/leasing, professional/technical services, accommodation/food and personal/repair services.
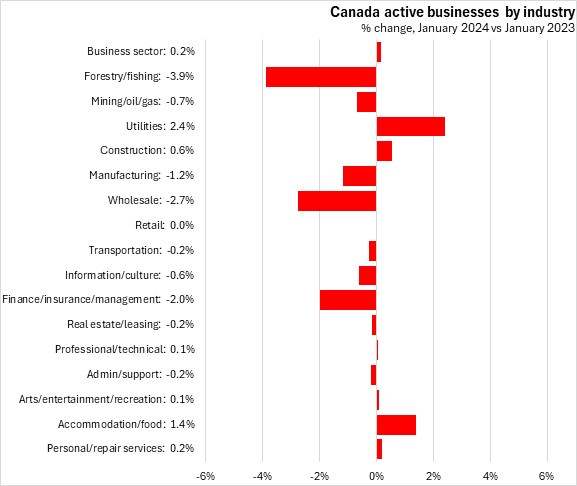
Nationally, the number of active businesses was down for many business sector industries except retail (unchanged), utilities, construction, professional/technical, arts/entertainment/recreation, accommodation/food, and personal/repair services.
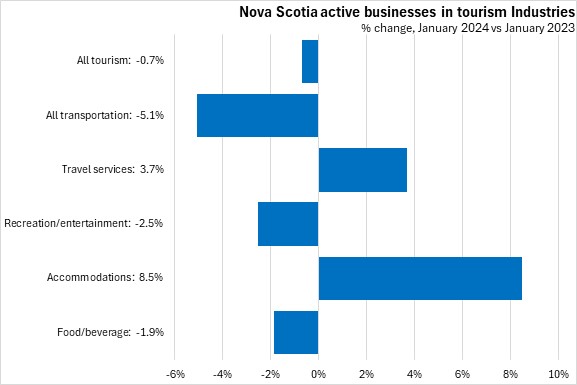
Statistics Canada has broken out specific data for tourism-related industries. Compared with January 2023, the number of active tourism-related businesses declined 0.7% in Nova Scotia as of January 2024, with declines in transportation, recreation/entertainment, and food/beverage, offsetting increases in travel services and accommodations.
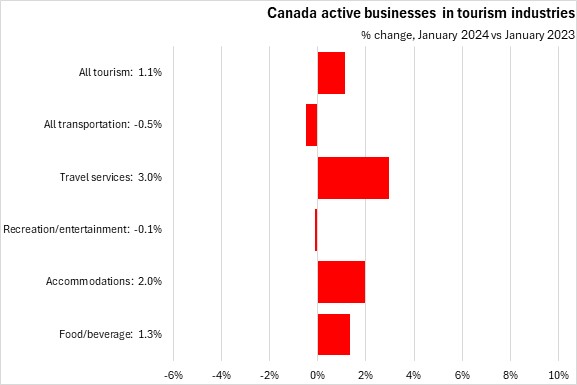
Nationally the number of tourism-related businesses increased 1.1% from January 2023 to January 2024. Growth in travel services, accommodations, and food/beverage offset declines in transportation and recreation/entertainment.
Trends
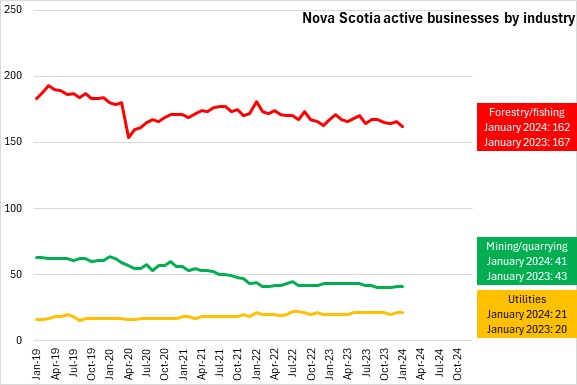
There has been a downward trend in forestry/fishing active businesses, while the decline in mining/quarrying has stabilized in the last year. Utilities have also been stable over the past year.
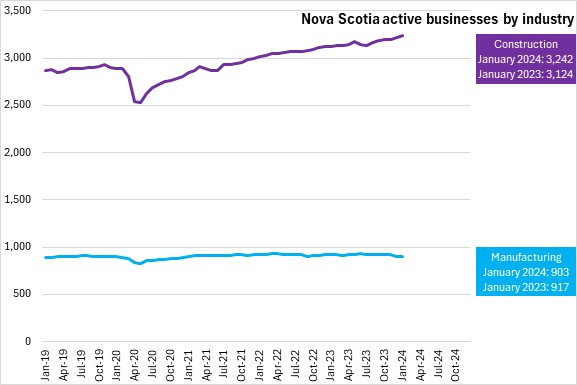
After the pandemic, the number of active businesses in construction have steadily grown. Manufacturing businesses have remained stable for the past 2 years.
There have been small growth in recent months in active personal/repair services, while arts/recreation and accomodation/food experienced a slight decline in active businesses.

Retail and wholesale businesses have declined in recent months.

Real estate/leasing active businesses have been growing since after the pandemic, while administrative/support/call centre businesses have a recent decline. Transportation businesses have been trending down slightly over the last year, but have bounced back in the past two months.

Growth in professional/technical services active businesses has stabilized in the recent months after steady gains in the last two years. Finance/insurance/management businesses have also trended down in recent months while the number of active businesses in information/culture has tredned up in recent months.
The source data is seasonally adjusted. The data may not aggregate due to firms being classified into multiple industry or geography.
Source: Statistics Canada. Table 33-10-0270-01 Experimental estimates for business openings and closures for Canada, provinces and territories, census metropolitan areas; Methodology: Business Opening and Closing CANADIAN INCOME SURVEY: POVERTY, 2022
Statistics Canada has released results from the Canadian Income Survey, reporting on incomes for 2022. This includes food security, median incomes as well as Canada's official poverty rate, as assessed against the Market Basket Measure threshold.
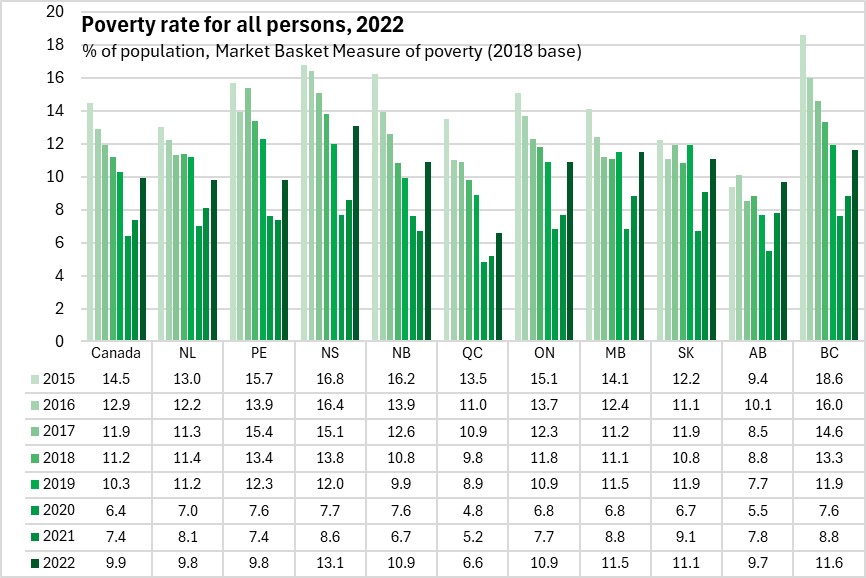
Note that there were significant government income supports during the COVID-19 pandemic which drove a large decline in the poverty rates for 2020 and 2021. These supports were largely withdrawn by 2022 while there was a significant acceleration in inflation.
Poverty Rates
The Market Basket Measure (MBM) estimates the share of the population that do not have sufficient income for a reference family to afford the cost of a basket of essential goods and services. The MBM threshold is estimated for specific communities. In Nova Scotia, there are separate thresholds for MBM in Halifax, Cape Breton, communities with populations between 30,000 and 100,000, communities with populations under 30,000 and rural areas. The Market Basket has recently been updated to 2018, with historical estimates provided back to 2015. These data are collected through the Canadian Income Survey. Indicators of poverty and income for smaller sub-components of the population may be of limited data quality.
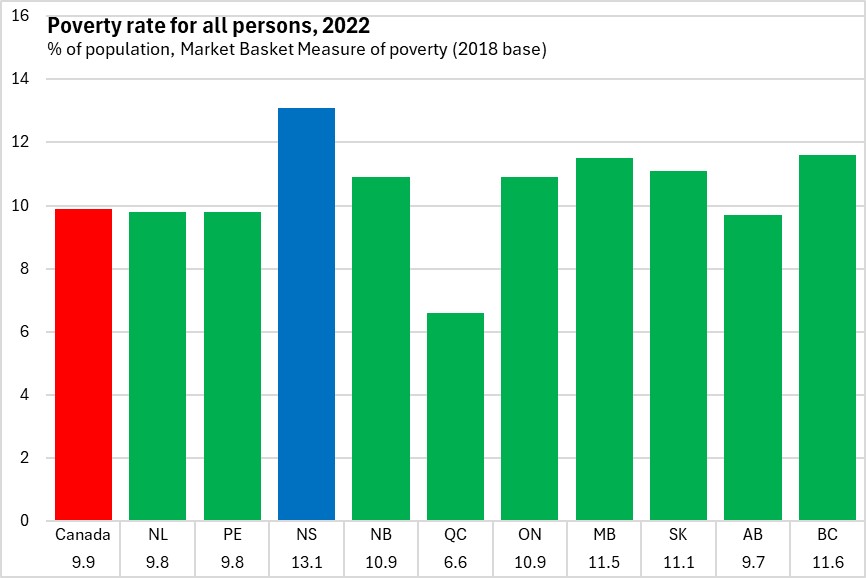
The poverty rate was 13.1% in Nova Scotia in 2022, up from 8.6% in 2021. This was the highest poverty rate among provinces - 1.5 percentage points above the next-highest poverty rate (11.6% in British Columbia). Nationally, 9.9% of the population were below the MBM poverty threshold. The lowest poverty rate was in Québec.
Poverty rates increased in all provinces from 2021 to 2022 as pandemic-related supports were withdrawn and inflation accelerated to levels not see in decades. Nova Scotia and New Brunswick reported the sharpest increases in poverty rates while Québec reported the least growth in poverty rate. With the most recent increases, poverty rates rose above pre-pandemic (2019) levels in Nova Scotia, New Brunswick and Alberta. 2022 poverty rates matched pre-pandemic levels in Ontario and Manitoba.
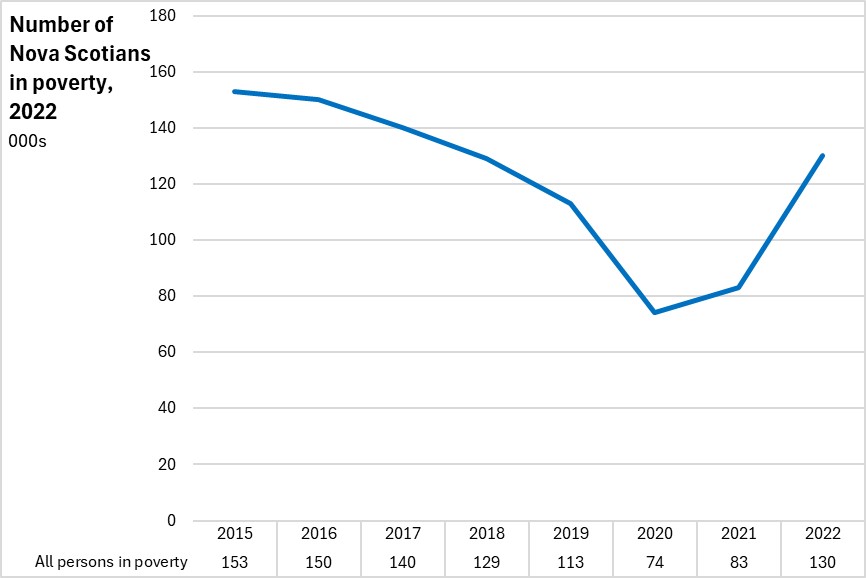
The number of Nova Scotians in poverty rose to 130,000 in 2022 - returning to figures last seen around 2018.
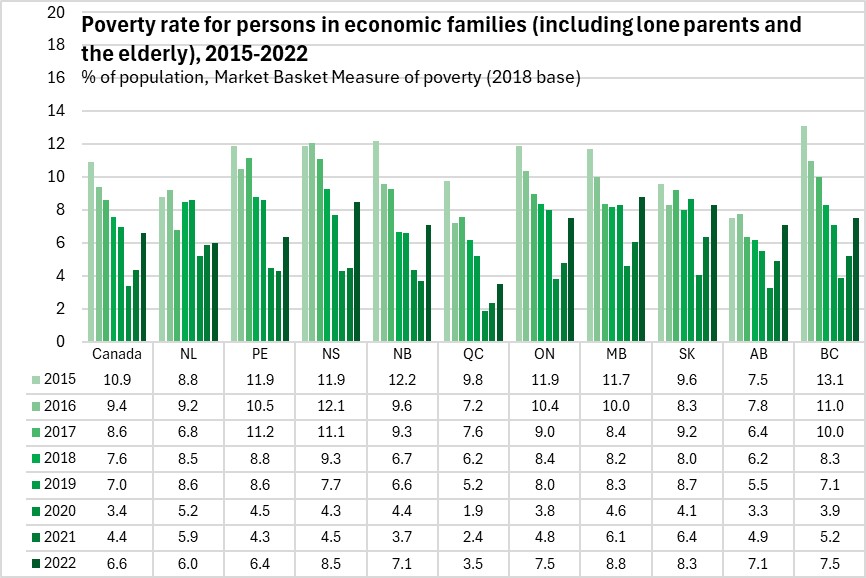
Persons in economic families (including both lone parents and the elderly) reported a poverty rate of 8.5% in Nova Scotia in 2022. This was above the national average of 6.6%. Manitoba reported the highest poverty rate among economic families while Québec reported the lowest.
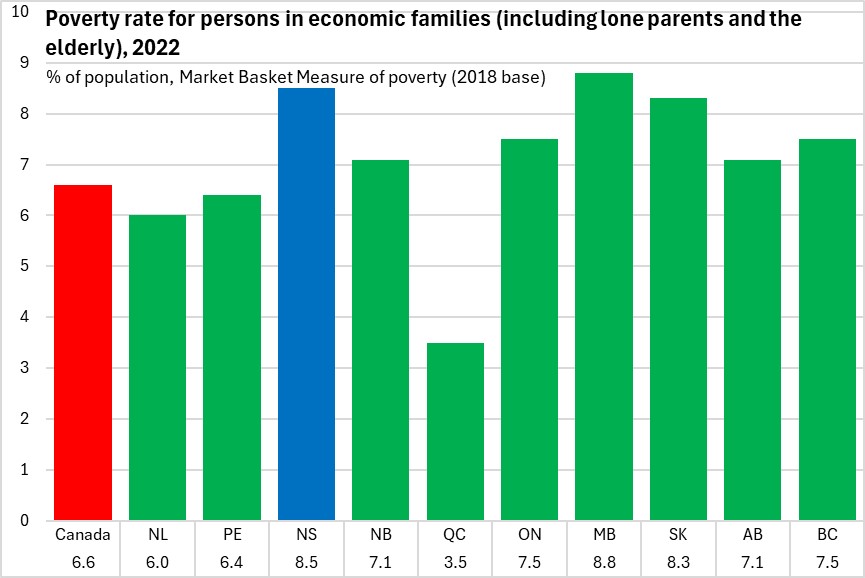
The poverty rate for economic families increased in all provinces in 2022. Poverty rates for economic families remained below pre-pandemic levels in Newfoundland and Labrador, Québec, Ontario and Saskatchewan.
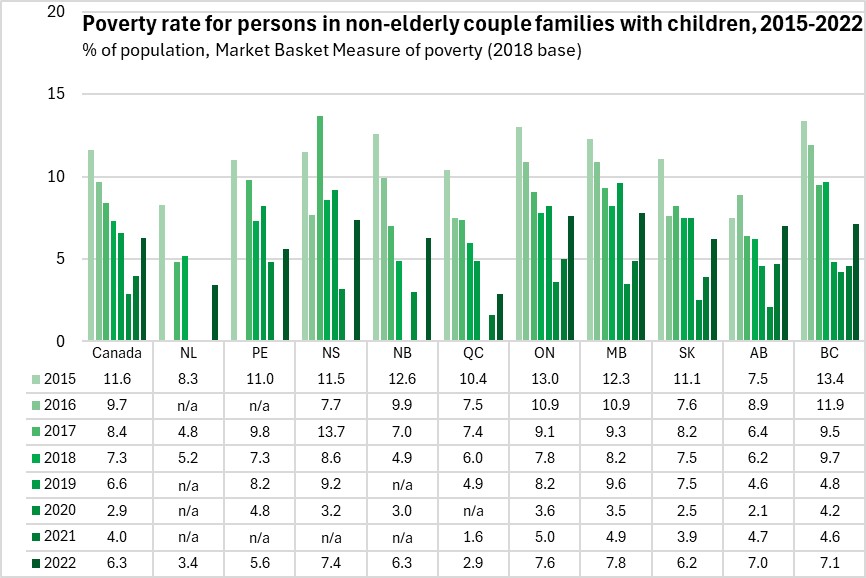
Poverty rates for couple families with children are typically lower than for other family cohorts. In Nova Scotia, 7.4% of couple families with children were below the MBM poverty line in 2022. This was above the national average of 6.3% (highest: Manitoba, lowest: Québec).
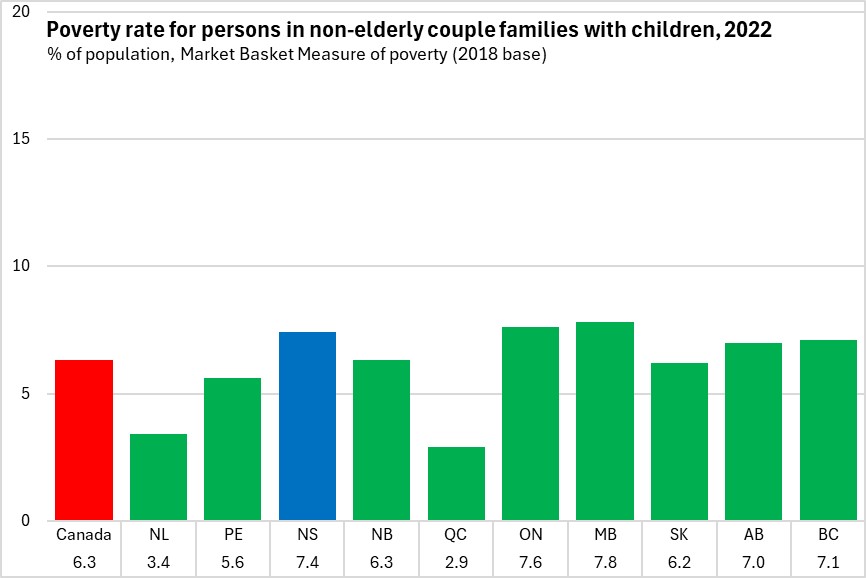
Data on poverty rates for couple families with children were missing for all Atlantic Canadian provinces in 2021 (with earlier data suppression in Québec, New Brunswick, Prince Edward Island and Newfoundland and Labrador for earlier years).
Poverty rates among couple families with children declined in many provinces after 2015, but have risen in more recent data.
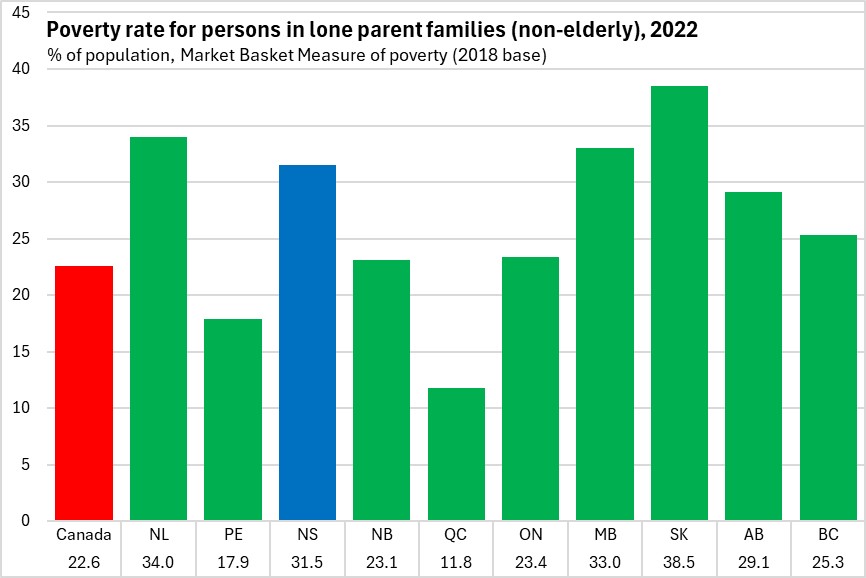
Lone parent families have historically had higher poverty rates than for couple economic families. In Nova Scotia, 31.5% of those in lone parent families lived in poverty, above the national average of 22.6% for these families. Lone parent poverty was highest in Saskatchewan and lowest in Québec.
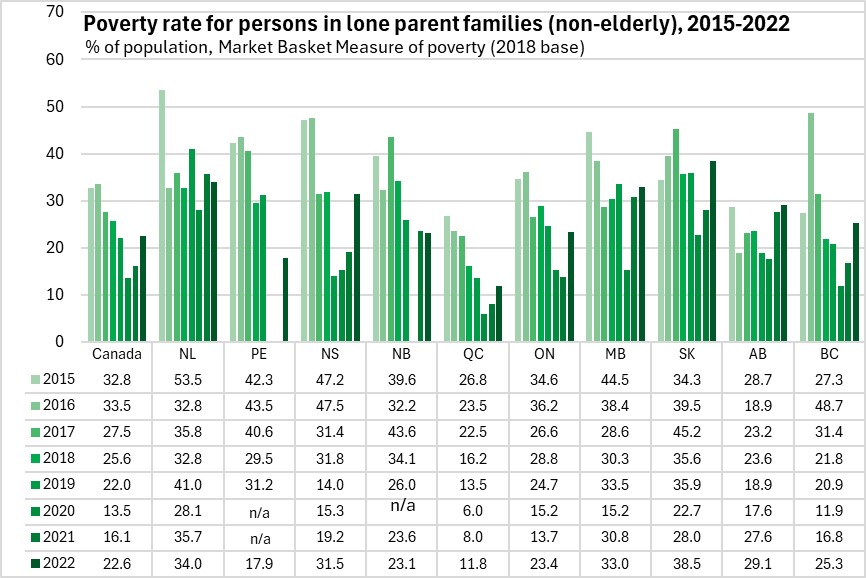
After much lower poverty rates among lone parent families in 2019, 2020 and 2021, Nova Scotia's lone parent poverty rate increased by 12.3 percentage points from 2021 to 2022. No other province reported as sharp an increase in poverty rates for lone parent families. Newfoundland and Labrador and New Brunswick reported declines in lone parent poverty rates.
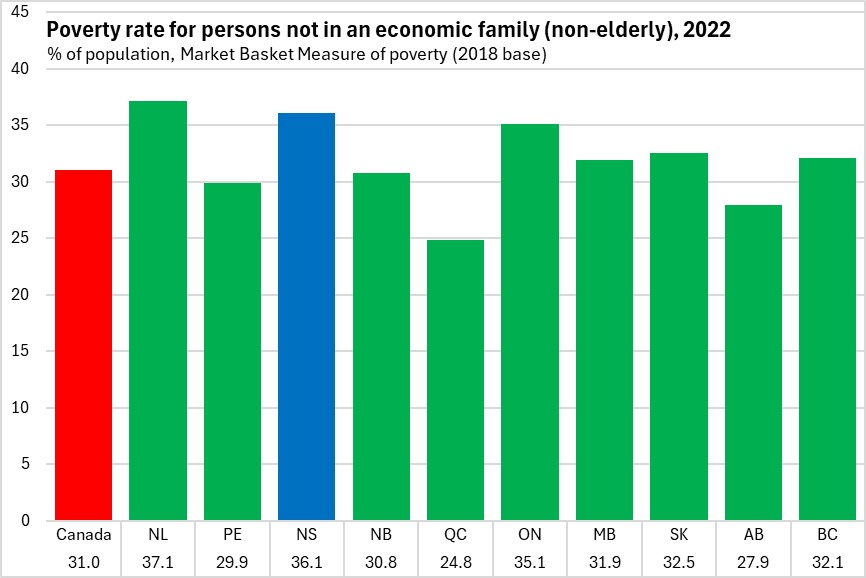
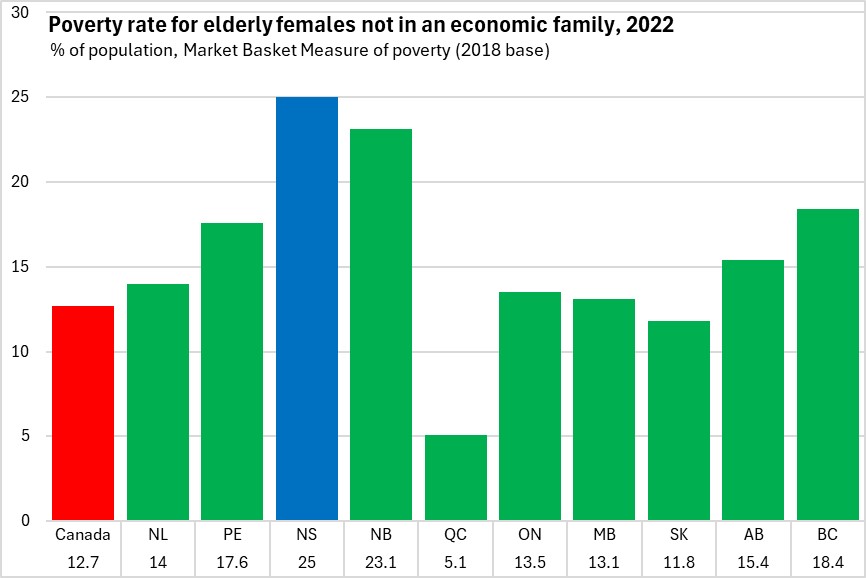
Persons not in economic families report the highest poverty rates. In 2022, 36.1% of Nova Scotians who were not in an economic family lived in poverty. This is above the national average. Persons not in economic families reported the highest poverty rates in Newfoundland and Labrador (followed by Nova Scotia) and the lowest poverty rates in Québec.
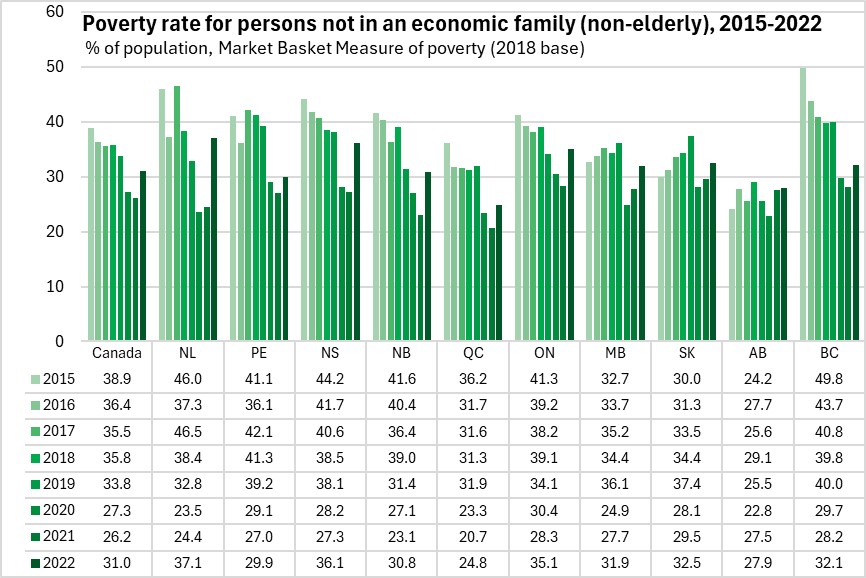
Nova Scotia's poverty rates for persons not in economic families increased for the first time since comparable records started in 2015. All provinces reported increases in poverty rates for persons not in an economic family from 2021 to 2022.
Persons in economic families (excl. lone parents) made up the largest number of persons in poverty in Nova Scotia, followed by non-elderly persons not in an economic family.
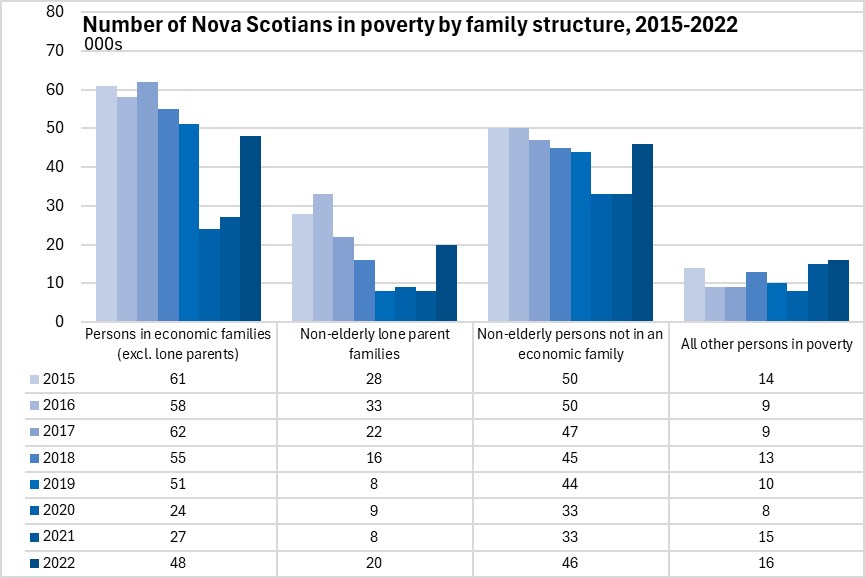
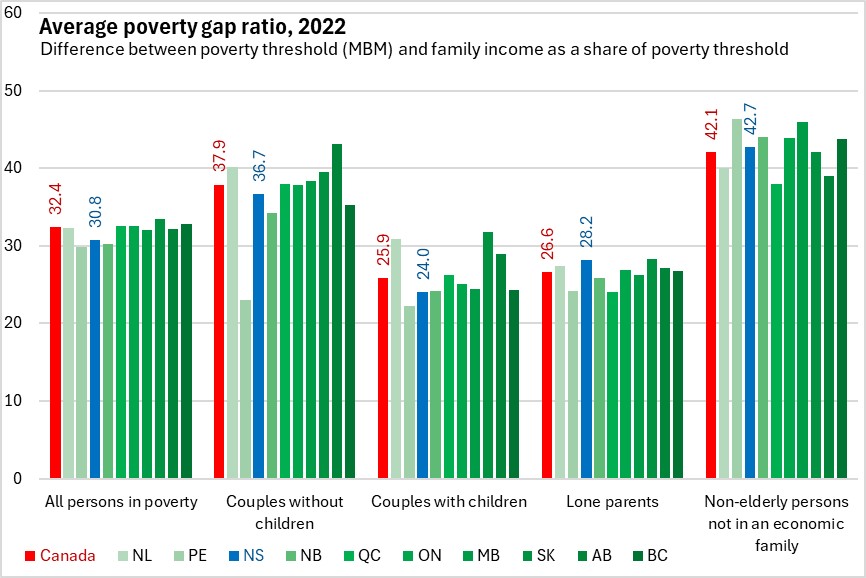
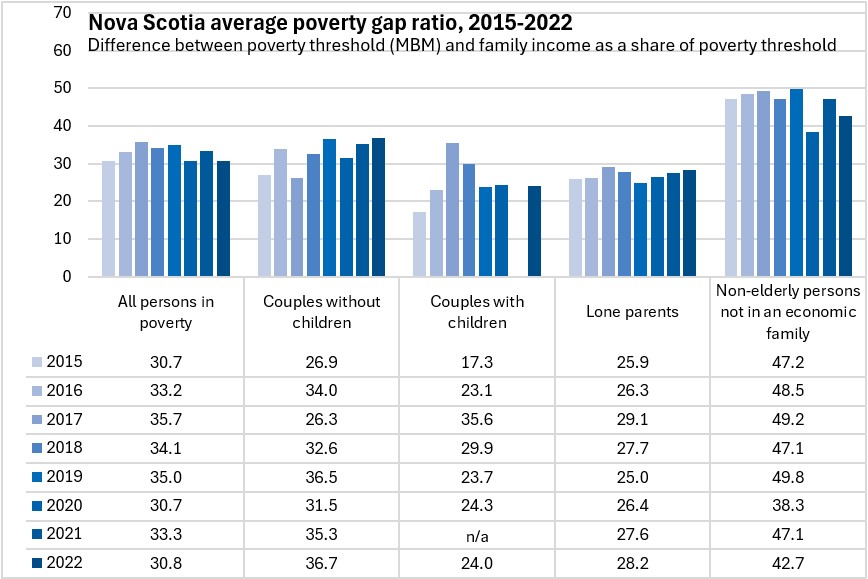
The average poverty gap reports the difference between the MBM threshold and family income, stated as a percentage of the threshold. For all Nova Scotians living in poverty in 2022, the gap was 30.8% of the MBM threshold, which was a smaller gap than the national average. The poverty gap ratio was smaller for lone parent families (28.2%) as well as for couples with children (24.0%). Non-elderly persons not in an economic family had both the highest poverty rates and poverty gap ratios.
Nova Scotia's average poverty gap ratios improved in 2022, reflecting gains for non-elderly persons not in an economic family.
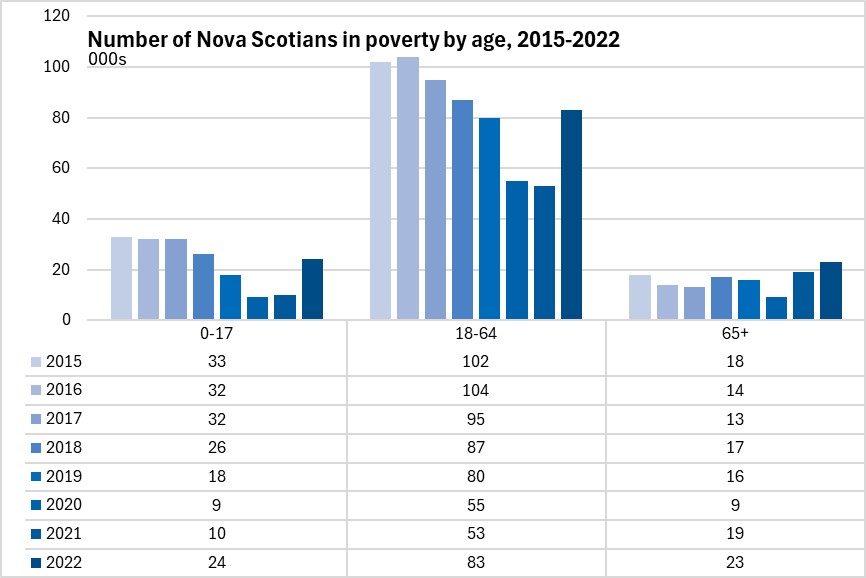
The majority of those living in poverty in Nova Scotia are between the ages of 18 and 64 years old. This is the case across the country, where this age cohort is clearly the largest part of the population.
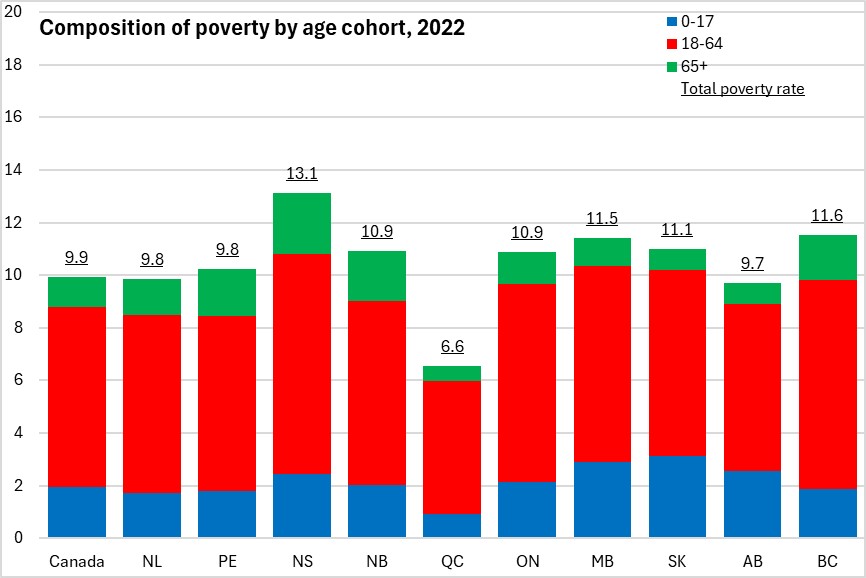
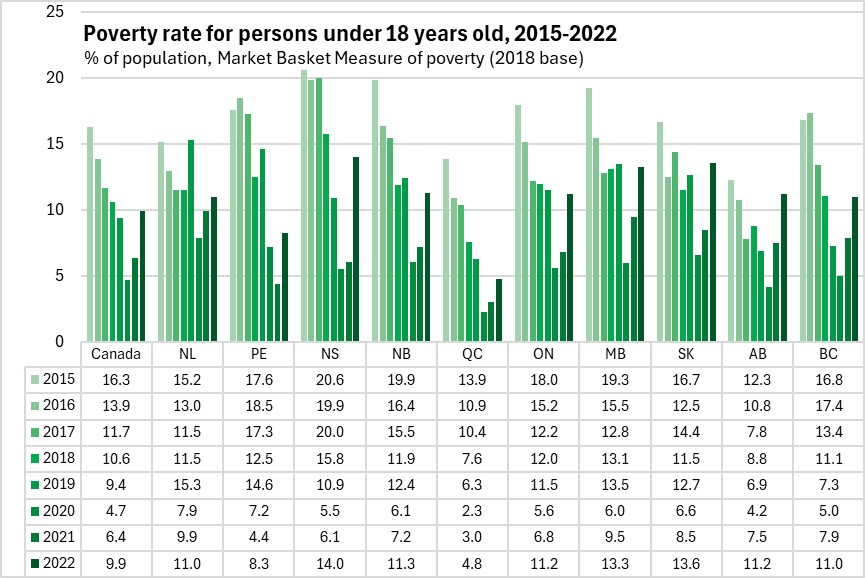
The child poverty rate in Nova Scotia was 14.0% in 2022 - the highest poverty rate for this age cohort. The national child poverty rate was 9.9% with the lowest prevalence in Québec.
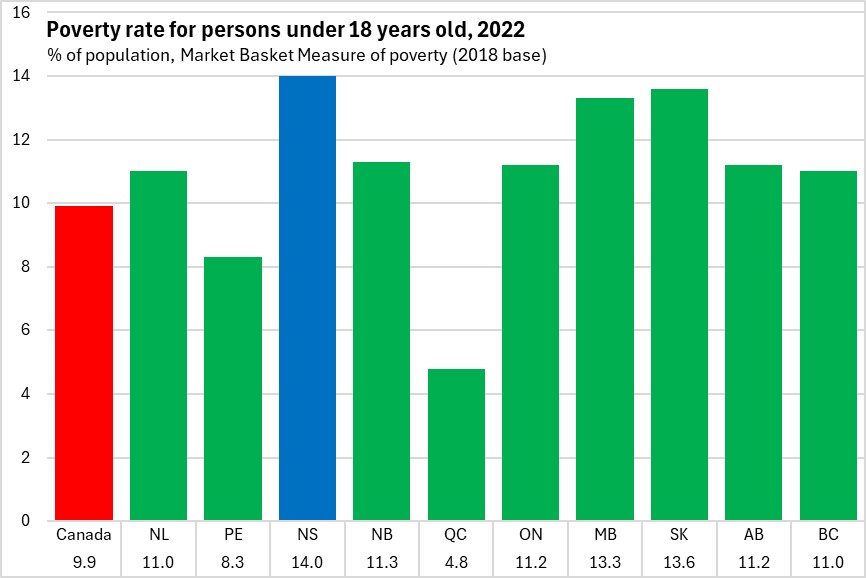
Every province reported an increase in child poverty rates in 2022, but the increase in Nova Scotia was the most acute: more than doubling.
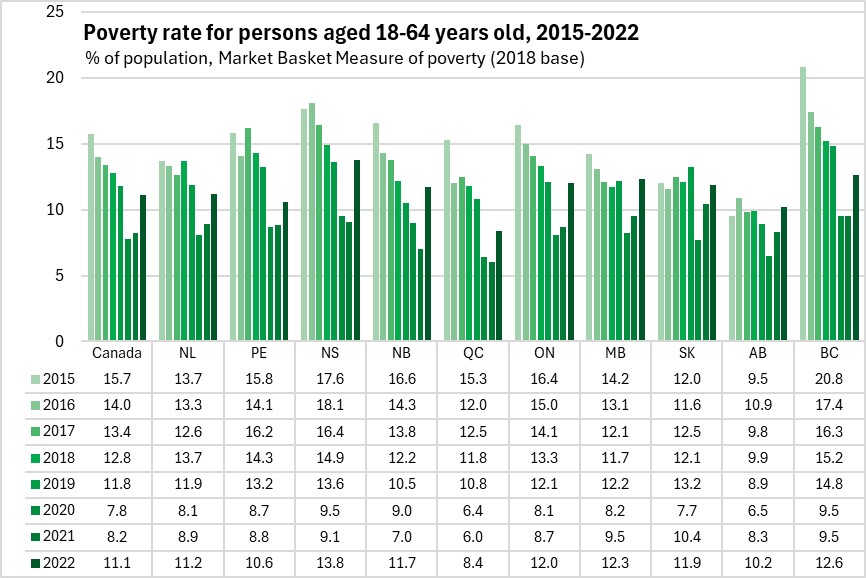
The poverty rate for those aged 18-64 was 13.8% in Nova Scotia, which was also the highest among provinces. The poverty rates for those aged 18-64 was 11.1% nationally with the lowest rate in Québec.
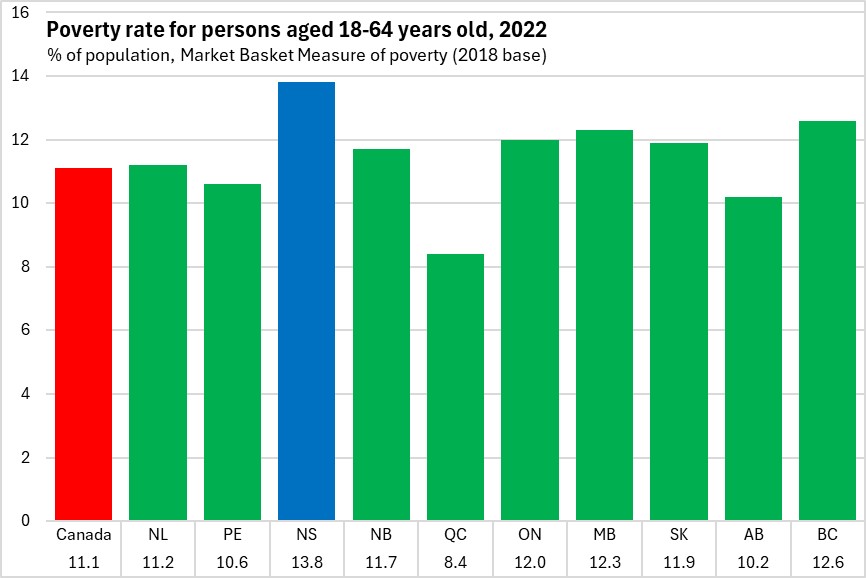
Poverty rates for those aged 18-64 increased in every province in 2022.
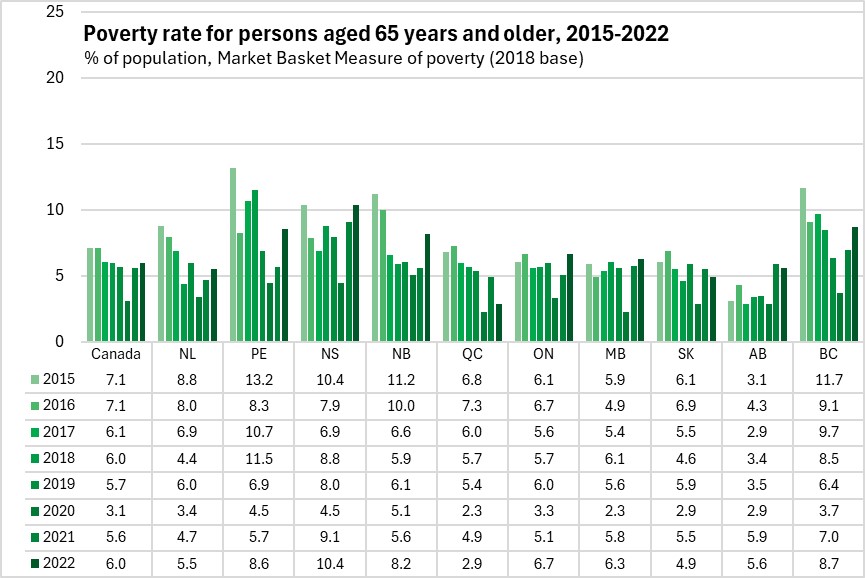
Nova Scotia's poverty rate among seniors was 10.4% - the highest rate among the provinces for this cohort. The national seniors poverty rate was 6.0% with the lowest value in Québec.
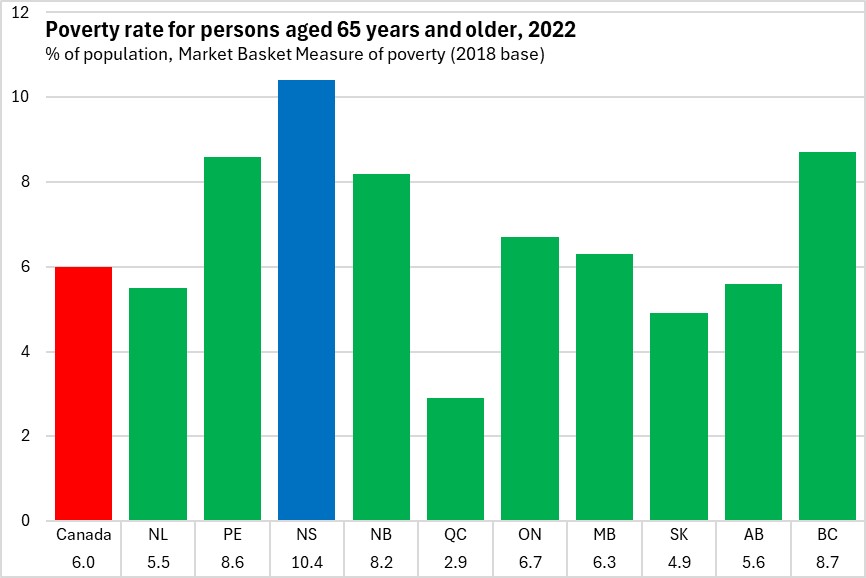
Seniors' poverty has increased in all provinces except Québec, Saskatchewan and Alberta in 2022. Nova Scotia reported a marked increase in the seniors poverty rate in 2021.
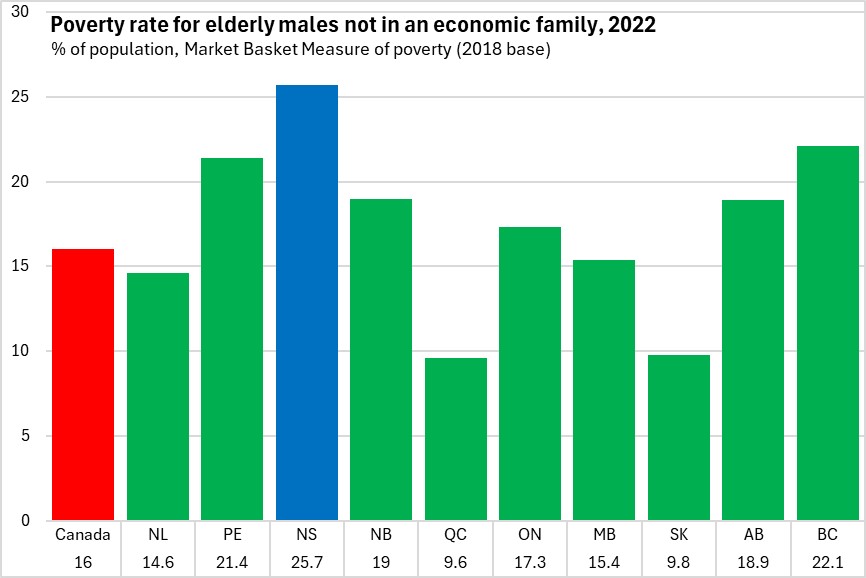
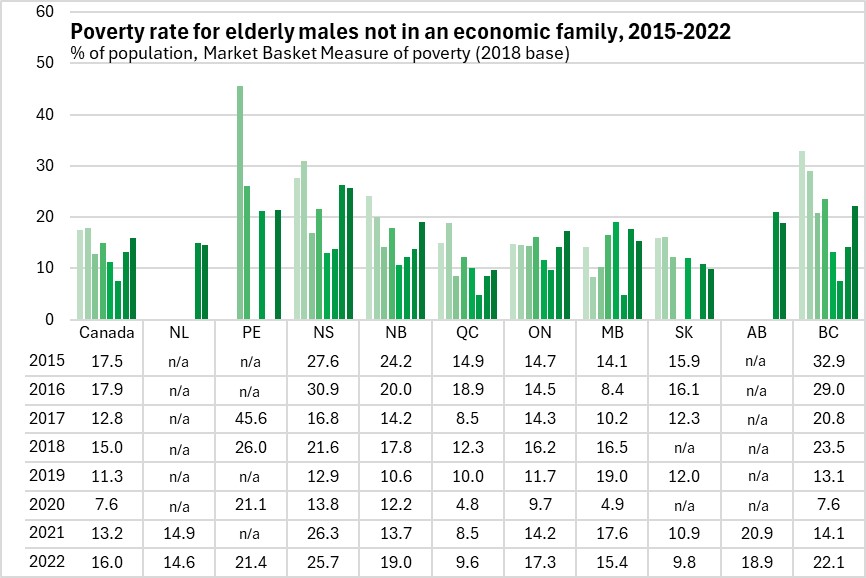
Among the population aged 65 and older, the number of Nova Scotians who live in poverty is highly concentrated among elderly persons not in an economic family. Of the 23,000 seniors in poverty in Nova Scotia, 15,000 of them were not in economic families, and of these a disproportionate number were women (10,000).
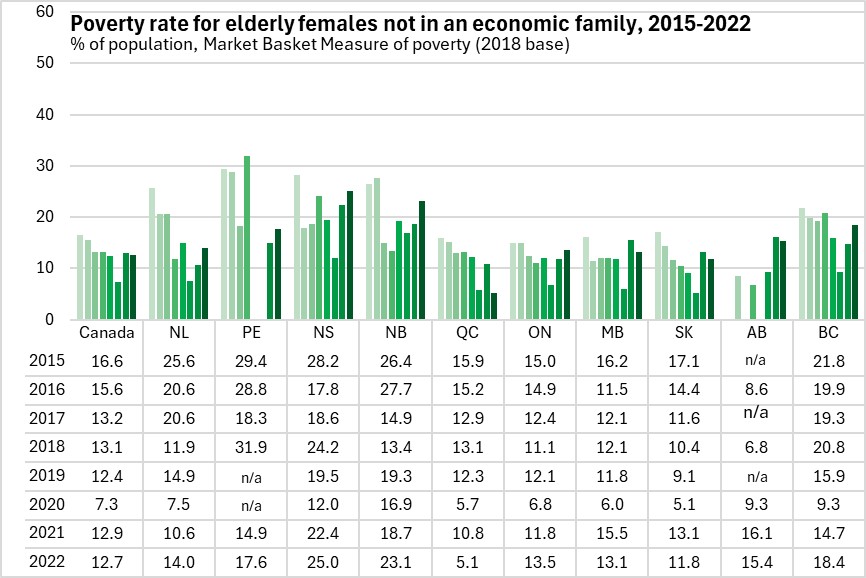
Poverty rates among elderly Nova Scotians not in an economic family were notably higher than for similar cohorts in other provinces, a phenomenon that emerged particularly in 2021 and continued in 2022.
The largest number of Nova Scotians living in poverty in 2022 were between the ages of 18 and 64: 83,000. There were about the same number of children (24,000) as seniors (23,000) living in poverty in Nova Scotia in 2022.
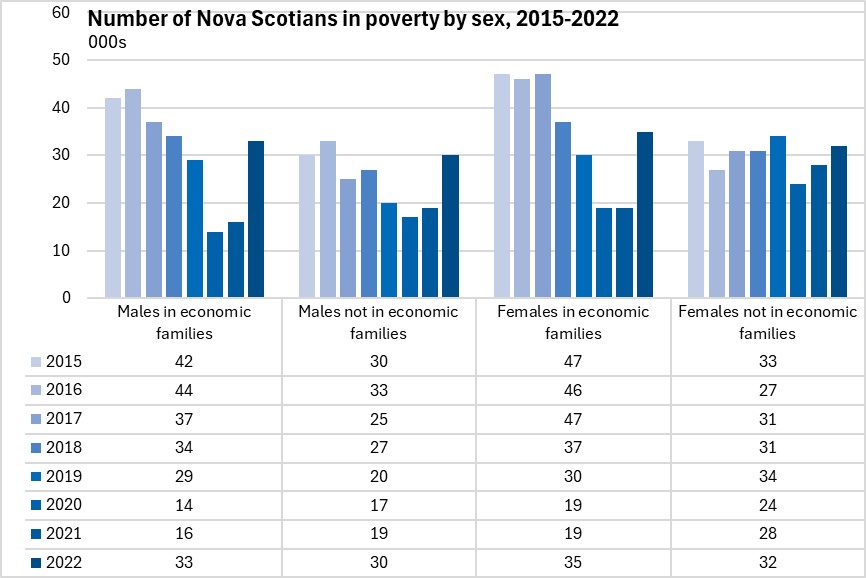
There were more females (67,000) than males (63,000) in poverty in Nova Scotia in 2022. In most provinces (Québec and Saskatchewan excepted), females make up a larger portion of those living in poverty.
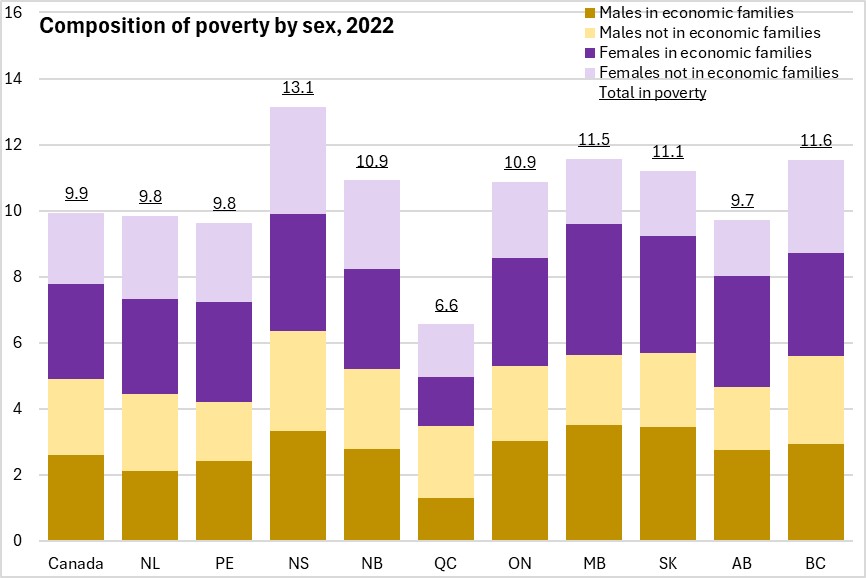
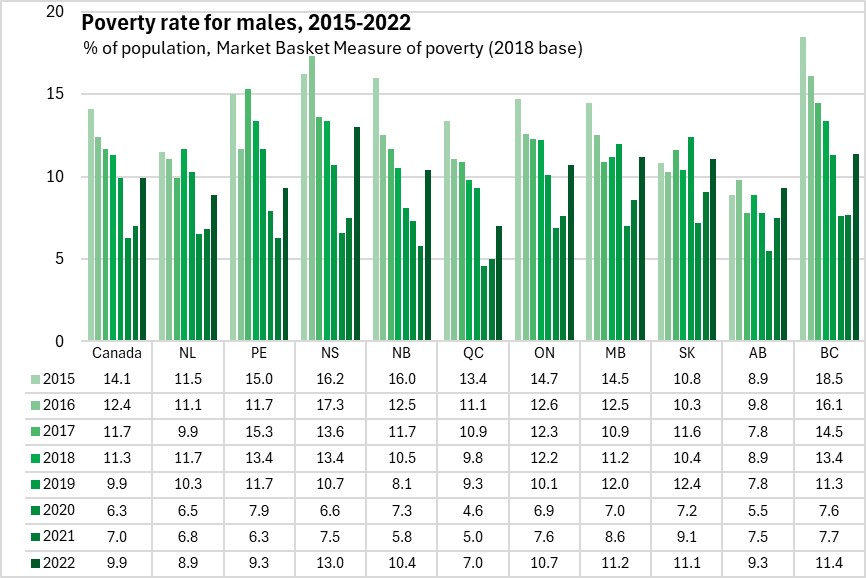
The male poverty rate was 13.0% in Nova Scotia in 2022 - highest among provinces. The male poverty rate was 9.9% nationally with the lowest prevalence in Québec.
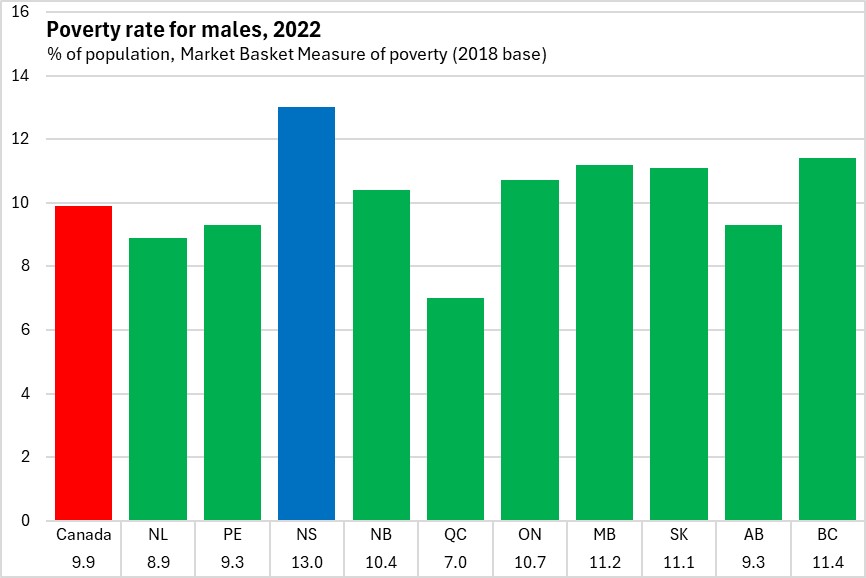
Male poverty rates increased for all provinces in 2022, though the increases were faster in Nova Scotia and New Brunswick.
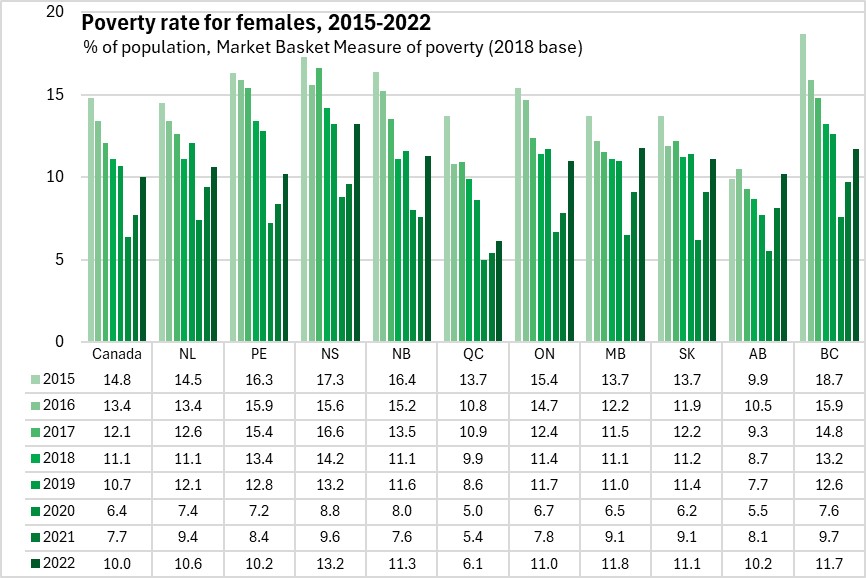
The female poverty rate was 13.2% in Nova Scotia in 2022, the highest female poverty rate among provinces. The national female poverty rate was 10.0% in 2022, with the the lowest female poverty rate in Québec.
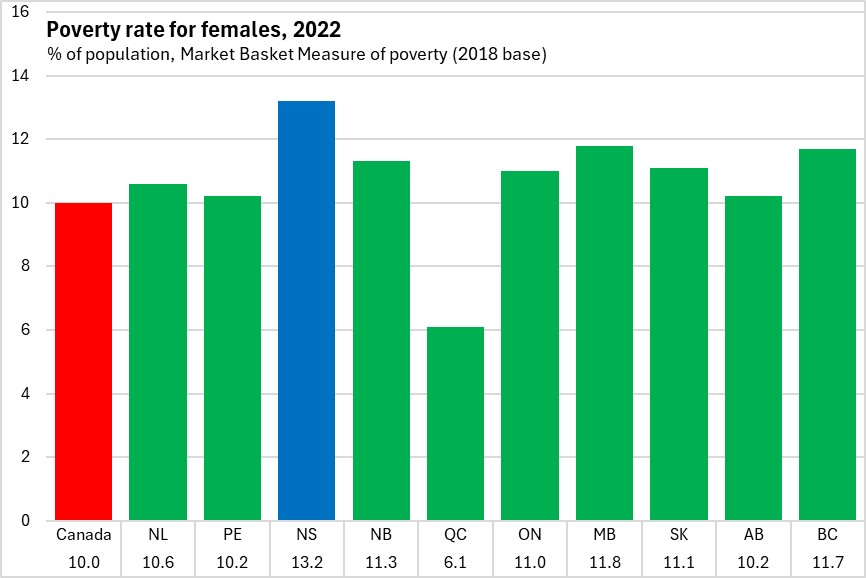
Female poverty rates rose in all provinces in 2022, with faster increases in Nova Scotia and New Brunswick.
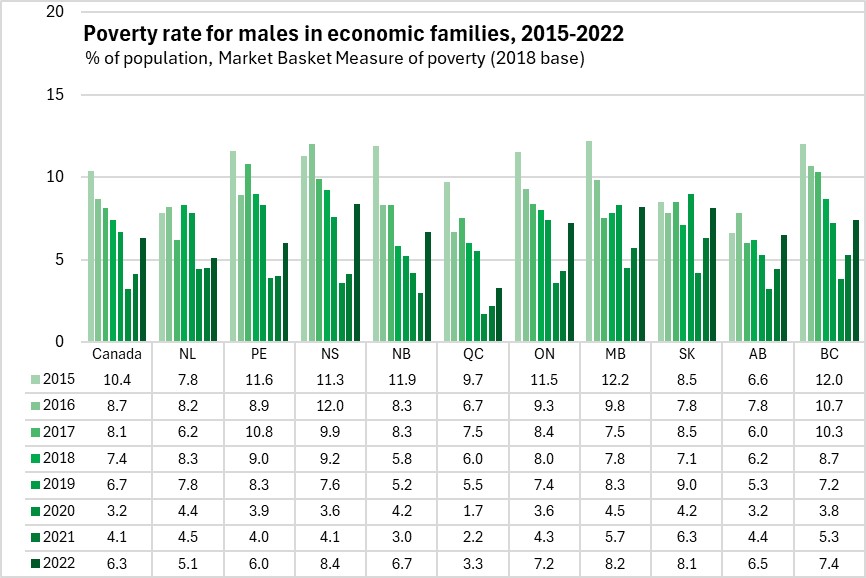
The poverty rate among Nova Scotia males in economic families was 8.4% in 2022 - the highest rate for this cohort among provinces. Nationally, males in economic families had a poverty rate of 6.3% with the lowest prevalence in Québec.
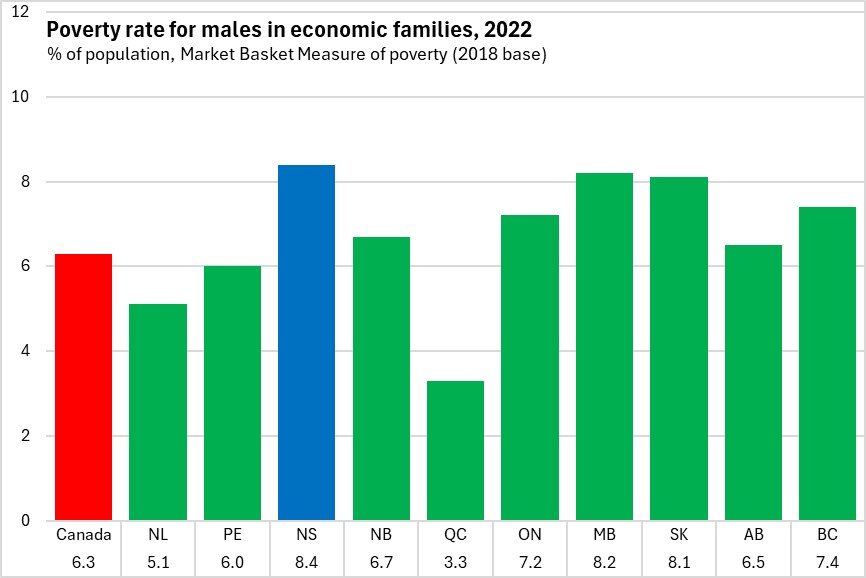
Poverty rates for males in economic families were up in every province in 2022.
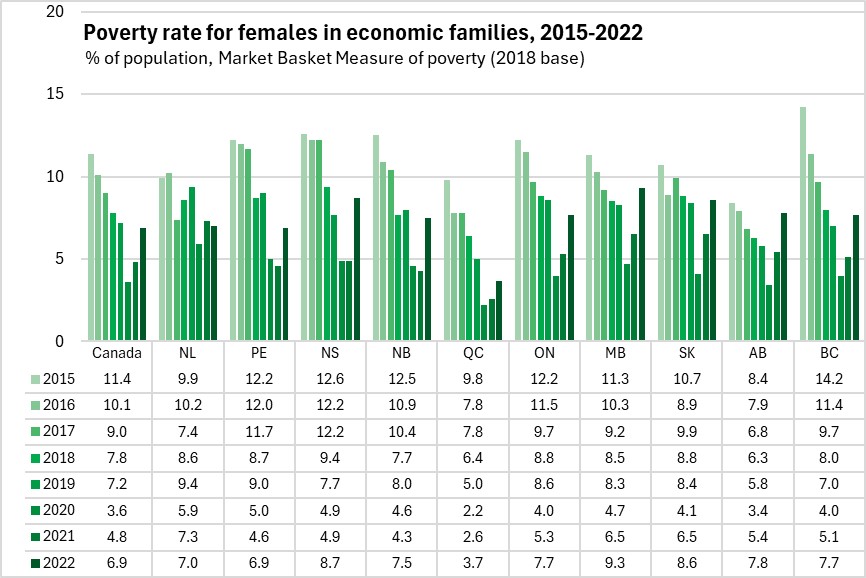
The poverty rate for females in an economic family in Nova Scotia was 8.7% in 2022 - second highest among provinces after Manitoba. Nationally, the poverty rate for females in an economic family was 6.9% with the lowest value in Québec.
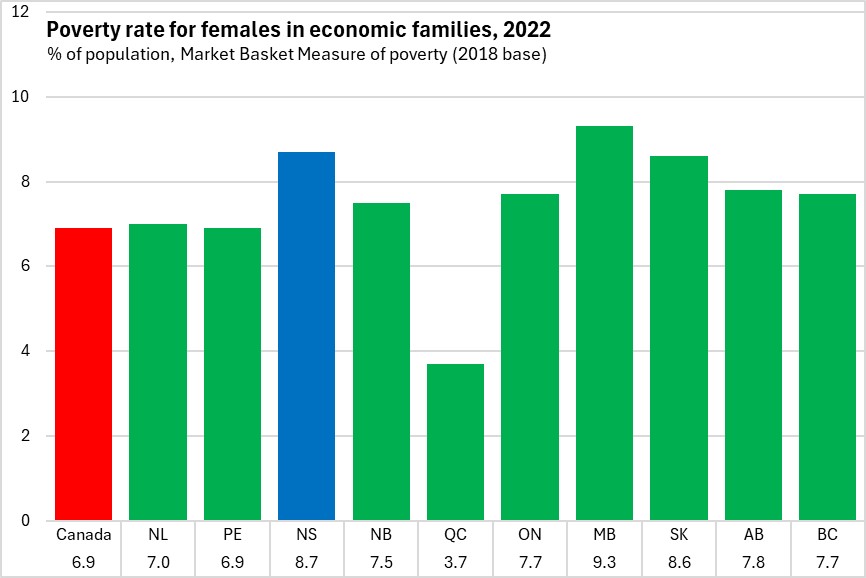
Poverty rates for females in economic families increased in every province except Newfoundland and Labrador in 2022.
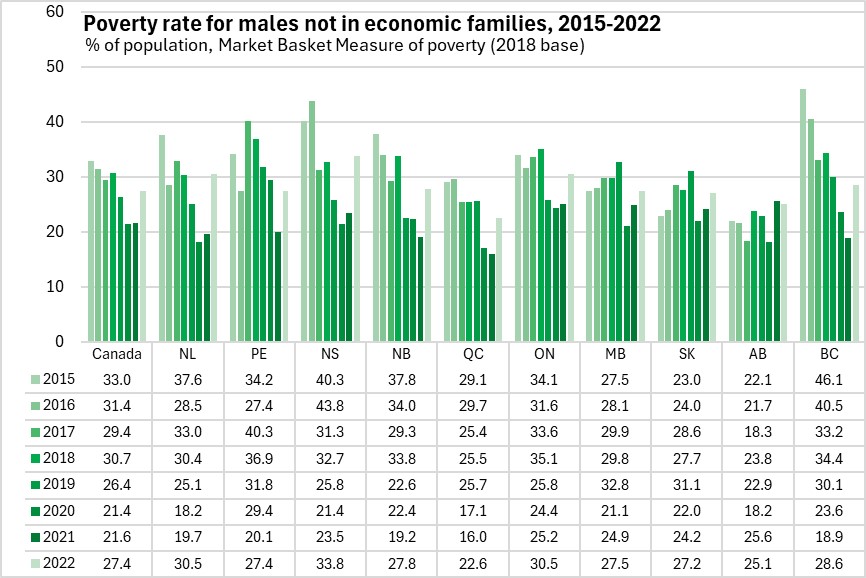
Nova Scotia's poverty rate for males not in an economic family was substantially higher at 33.8% in 2022.
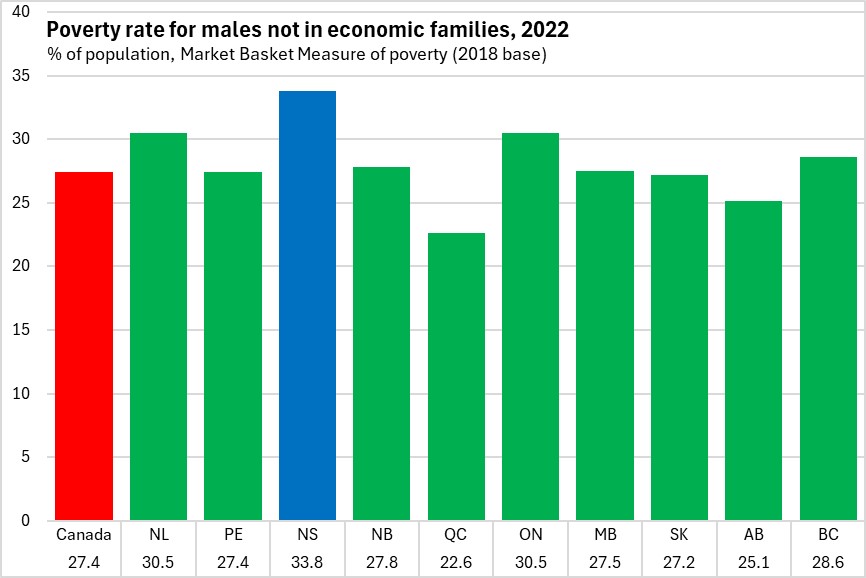
Poverty rates for males not in an economic family increased in every province except Alberta.
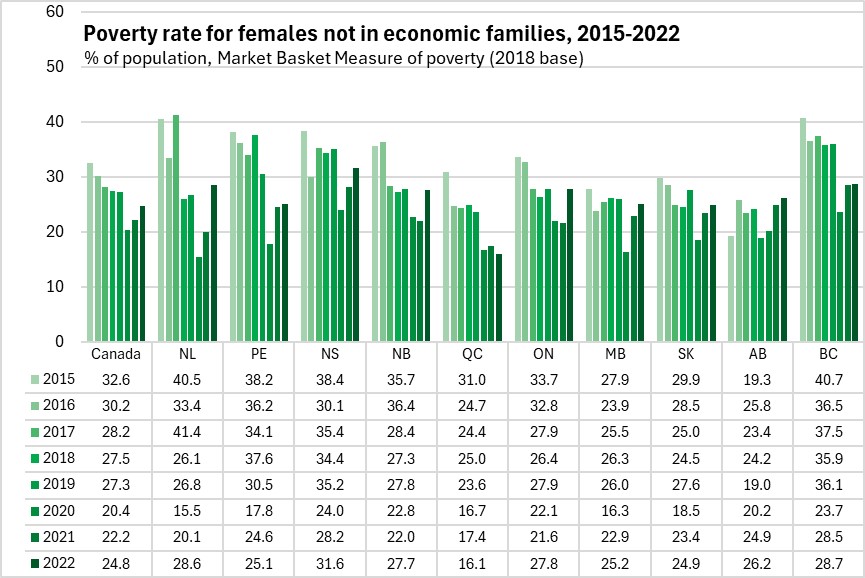
Nova Scotia's poverty rate for females not in an economic family was 31.6% in 2022 - the highest among provinces. Nationally, females not in an economic family had a poverty rate of 24.8% with the lowest value in Québec.
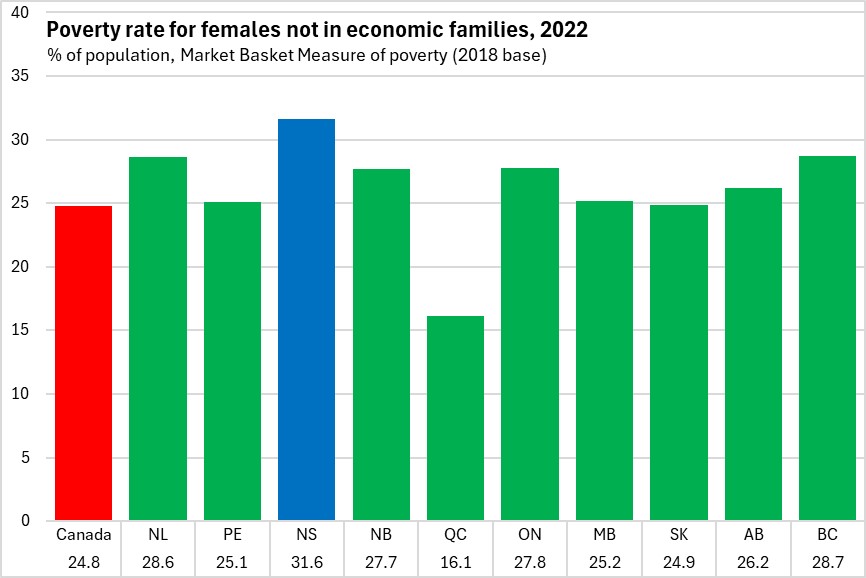
Poverty rates for females not in an economic family increased in every province except Québec in 2022.
The number of females in poverty outnumbered males in poverty by 4,000.
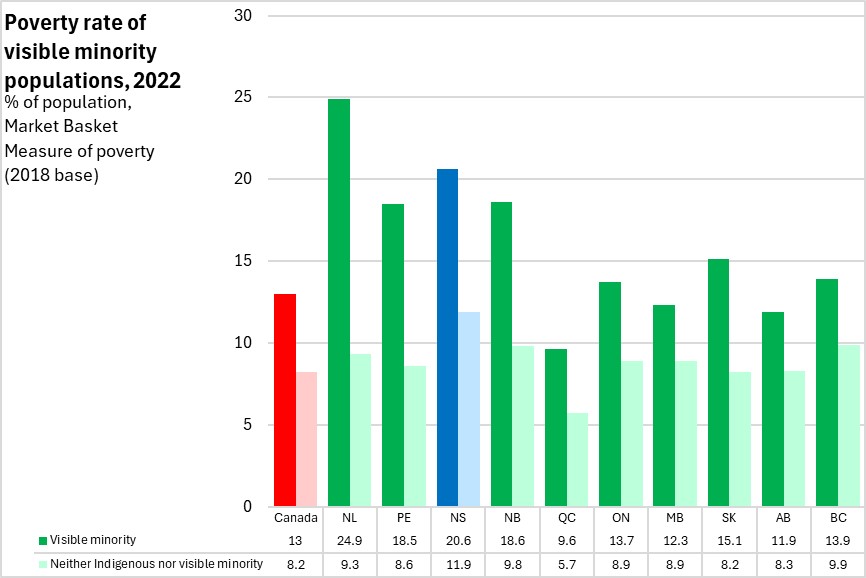
Statistics Canada's reported poverty rates now include categories for racialized persons (defined as identifying with 'visible minority' populations).
Poverty rates among those who identify with a visible minority category were substantially higher in Nova Scotia (20.6%) than for those who identified neither as Indigenous nor as a visible minority (11.9%). Visible minority populations reported higher poverty rates in all provinces. The largest gaps between the poverty rates for visible minority populations and those who identified neither as Indigenous nor as a visible minority were reported in Atlantic Canada (particularly in Newfoundland and Labrador).
Threshold
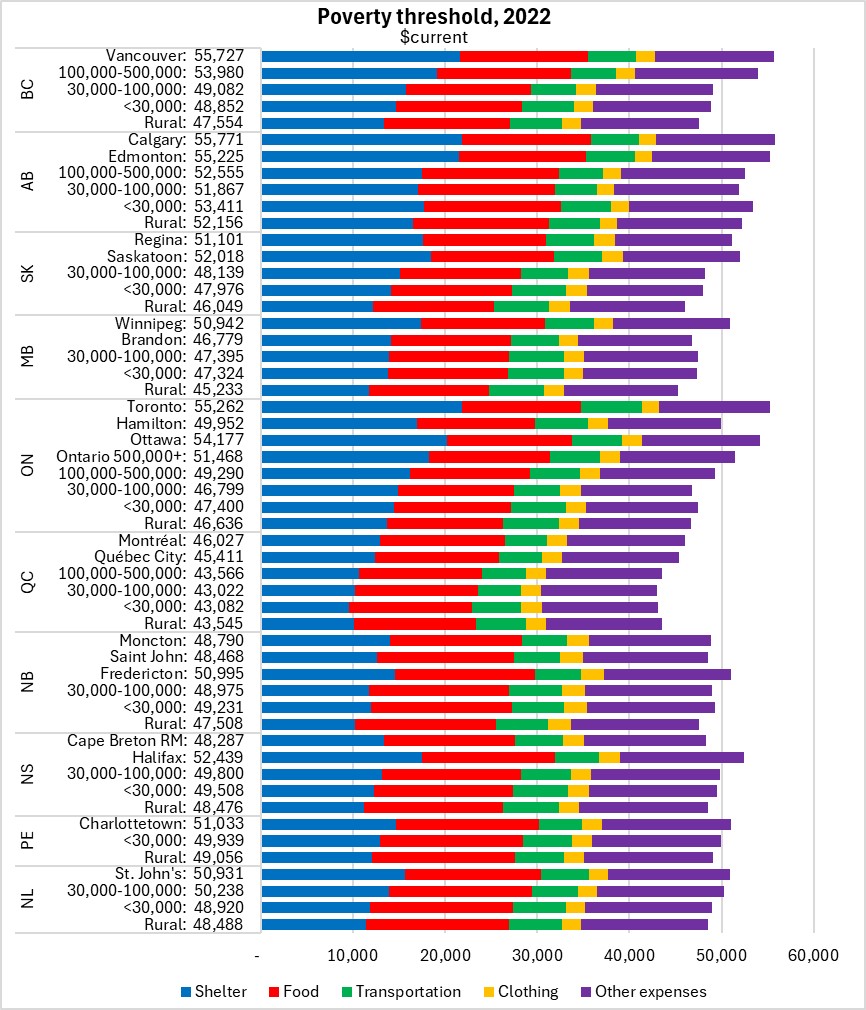
The threshold for the poverty rate varies by province and community size. In Nova Scotia, the income required for a reference family (2 adults, 2 children) to afford a basic standard of living ranged from $48,287 in Cape Breton RM to $52,439 in Halifax. The highest thresholds were reported in larger cities: Vancouver, Calgary, Edmonton, Toronto and Ottawa. The lowest thresholds were in smaller communities of Québec.
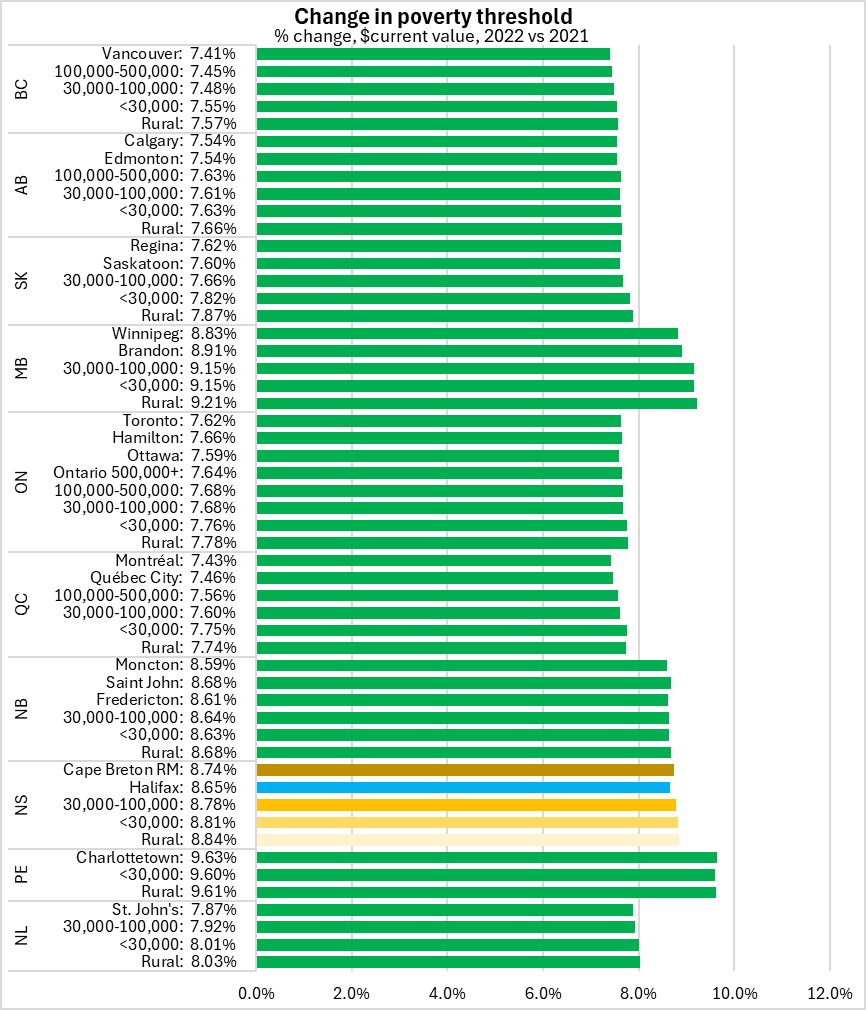
Compared with the thresholds from 2021, Nova Scotia's Market Basket Measure threholds increased by between 8.65% and 8.84%. MBM threshold levels grew faster in the Maritime Provinces and Manitoba.
Notes and definitions
The Canadian Income Survey estimates are based on probability samples and are therefore subject to sampling variability. As a result, estimates will show more variability than trends observed over longer time periods.
The market basket measure (MBM) of poverty is based on the cost of a specific basket of goods and services representing a modest, basic standard of living. It includes the costs of food, clothing, footwear, transportation, shelter and other expenses for a reference family. These costs are compared with the disposable income of families to determine whether or not they fall below the poverty line.
An economic family refers to a group of two or more persons who live in the same dwelling and are related to each other by blood, marriage, common-law union, adoption or a foster relationship. This concept differs from the census family concept used for subprovincial data in the Annual Income Estimates for Census Families and Individuals.
Sources: Statistics Canada, Canadian Income Survey. Table 11-10-0135-01 Low income statistics by age, sex and economic family type; Table 11-10-0136-01 Low income statistics by economic family type; Table 11-10-0093-01 Poverty and low-income statistics by selected demographic characteristics CANADIAN INCOME SURVEY: INCOME DISTRIBUTION, 2022
Median incomes
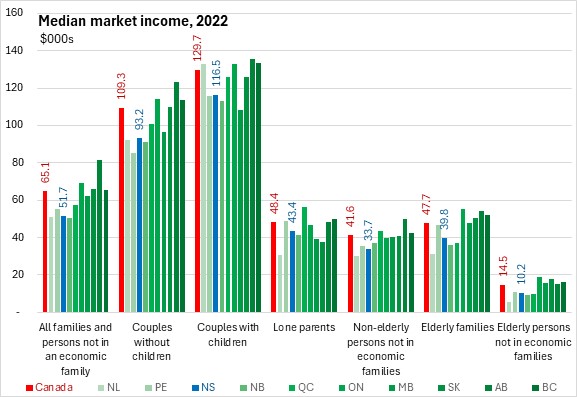
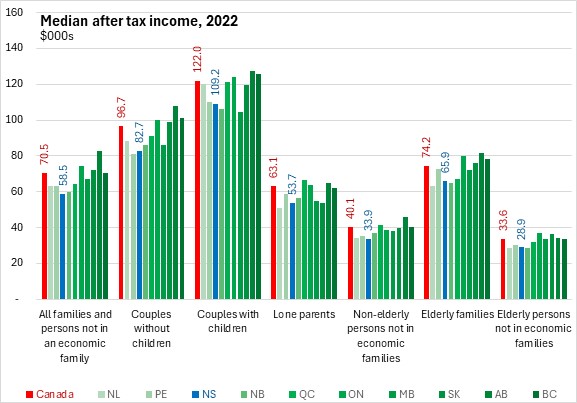
Median incomes are the level of income at which half the population had higher income and half had lower income. Median incomes are frequently used in making income comparisons because, unlike averages, they are not influenced by outliers with very high values.
The median market income for all Nova Scotians (whether in an economic family or not) in 2022 was $51,700. However, with more than one potential earner, median market incomes are substantially higher for couple families: $93,200 for couple families without children and $116,500 for couple families with children. Median market incomes for Nova Scotia's lone parents ($43,400) were higher than for non-elderly persons not in an economic family ($33,700). As many elderly persons are retired, their dependence on market sources of income is lower.
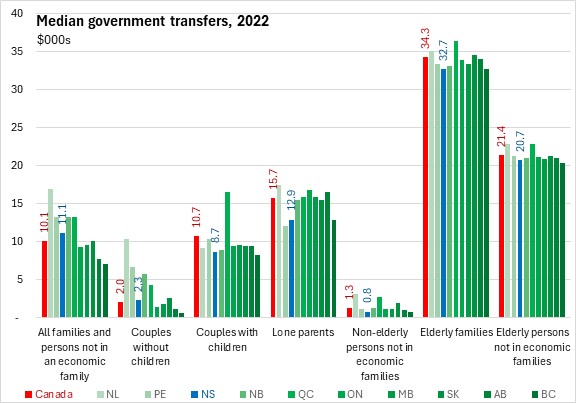
Households don't just rely on market sources for income. Government transfers such as Canada Pension Plan, Employment Insurance and Canada Child Benefit also make up a substantial part of household total income.
Median government transfers for Nova Scotians were $11,100 in 2022. Elderly families ($32,700) and elderly persons not in economic families ($20,700) reported the highest median government transfers, followed by lone parents ($12,900) and couple families with children ($8,700). Couple families without children and non-elderly persons not in economic families reported much lower median government transfers.
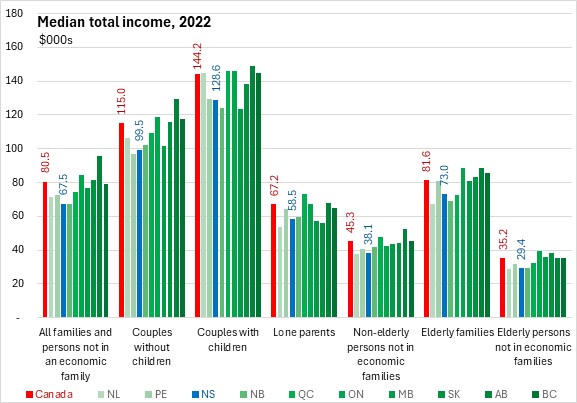
Total income includes market income and government transfers.
Median total income for all persons (whether in economic families or not) was $67,500 in 2022. Couple families without children ($99,500) and with children ($128,600) reported the highest median total incomes owing to their higher median market incomes. Elderly families ($73,000) and lone parent families ($58,500) reported the next highest median total incomes reflecting combined effects of market incomes and government transfers. Persons not in economic families reported the lowest median total incomes ($38,100 for non-elderly persons not in economic families and $29,400 for elderly persons not in economic families).
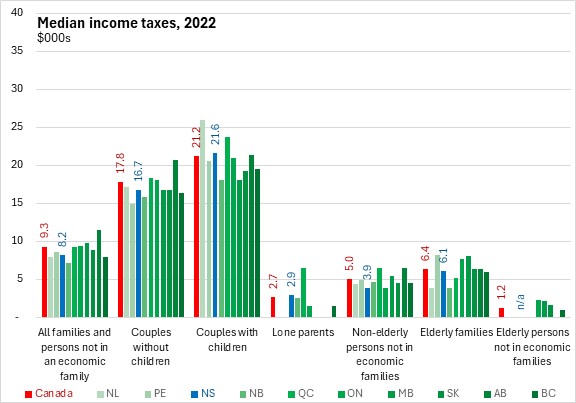
Government income taxes reduce disposable income available for household spending.
Median income taxes were $8,200 for all Nova Scotians. This was higher for those in couple families (with or without children).
Median after-tax income was $58,500 in Nova Scotia. Couple families with children ($109,200) reported the highest median after tax incomes, followed by couple families without children ($82,700), elderly families ($65,900) and lone parent families ($53,700). Median after tax incomes were substantially lower for persons not in economic families ($33,900 for non-elderly persons not in economic families and $28,900 for elderly persons not in economic families).
Income distribution
Among economic families, 48.3% of Nova Scotian families had income above $100,000 in 2022 (58.8% nationally). A further 28.6% reported incomes between $60,000 and $100,000 (23.5% nationally) while 13.4% reported incomes between $40,000 and $60,000 (11.1% nationally). A total of 9.8% of Nova Scotia economic families reported income under $40,000 (6.6% nationally).

The distribution of income is notably different among persons not in an economic family. Just 5.7% of Nova Scotians not in an economic family reported income over $100,000 (10.1% nationally). Another 17.4% reported income between $60,000 and $100,000 (20.7% nationally) along with 20.2% that reported income between $40,000 and $60,000 (21.3% nationally). Among Nova Scotians not in an economic family, 38.6% reported incomes between $20,000 and $40,000 (30.8% nationally) while 18.0% (17.2% nationally) reported income under $20,000 in 2022.

Gini coefficient of income distribution
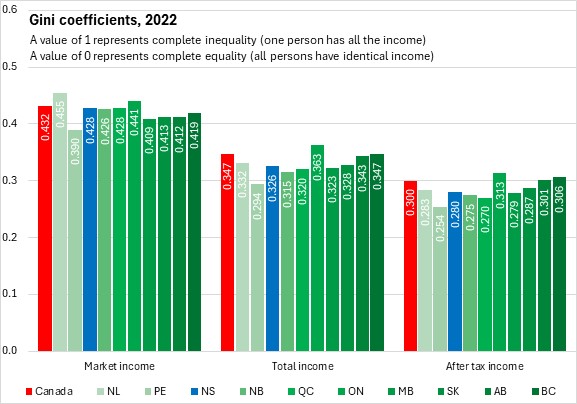
The Canadian Income Survey also reports the Gini coefficient measure of income distribution. Gini coefficients range between zero (representing perfect equality in which all individuals have the same income) and one (representing perfect inequality in which only one person has all the income while others have none). A higher Gini coefficient means greater income inequality.
Gini coefficients can be measured for market income, total income (market income plus transfers) and after-tax income (total income less taxes).
By any income measure, Nova Scotia's Gini coefficient was below the national Gini coefficient, reflecting a more equal distribution of income (whether market, total or after-tax income).
For market income, Newfoundland and Labrador had the highest Gini coefficient (most inequality) while Prince Edward Island had the lowest Gini coefficient (most equality).
For both total income and after-tax income, Ontario had the highest Gini coefficients (most inequality) while Prince Edward Island had the lowest Gini coefficients (most equality).
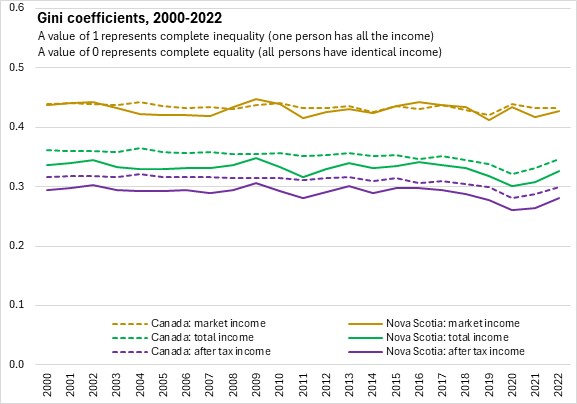
Income inequality decreased from 2016 to 2019 at both the national and Nova Scotia levels. This has been mainly caused by greater income equality in market sources. However, in 2020, Gini coefficients increased for market income (both provincially and at the national level) while total and after-tax inequality measures declined. This is due to the role of employment loss in low-wage occupations and extraordinary government transfers during the pandemic in 2020.
In 2021, market Gini coefficients declined while the total and after-tax Gini coefficients rose. In 2022, Gini coefficients for total, market and after-tax income increased in Nova Scota. Nationally, total and after-tax measures of inequality increased while the Gini coefficient for market income was unchanged.
Notes and definitions
The median is the level of income at which half the population had higher income and half had lower. Income estimates are expressed in 2018 constant dollars to factor in inflation and enable comparisons across time in real terms.
After-tax income is the total of market income and government transfers, less income tax.
Market income consists of employment income and private pensions, as well as income from investments and other market sources.
Government transfers include benefits such as Old Age Security, the Guaranteed Income Supplement, the Canada Pension Plan and the Quebec Pension Plan, Employment Insurance, social assistance, the goods and services tax credit, provincial tax credits, and various types of child benefits.
Sources: Statistics Canada, Canadian Income Survey. Table 11-10-0134-01 Gini coefficients of adjusted market, total and after-tax income; Table 11-10-0190-01 Market income, government transfers, total income, income tax and after-tax income by economic family type; Table 11-10-0237-01 Distribution of market, total and after-tax income by economic family type, Canada, provinces and selected census metropolitan areas (CMAs) CANADIAN INCOME SURVEY: FOOD SECURITY, 2022
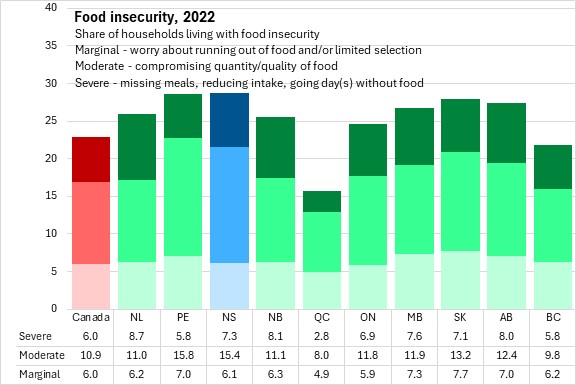
Statistics Canada reports on food security and insecurity as part of the Canadian Income Survey. Food insecurity refers to households that have inadequate or insecure access to food due to financial constraints.
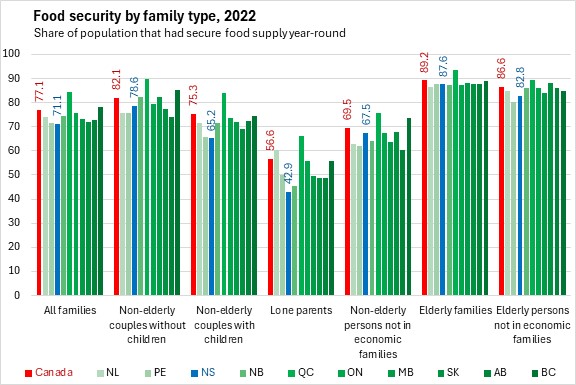
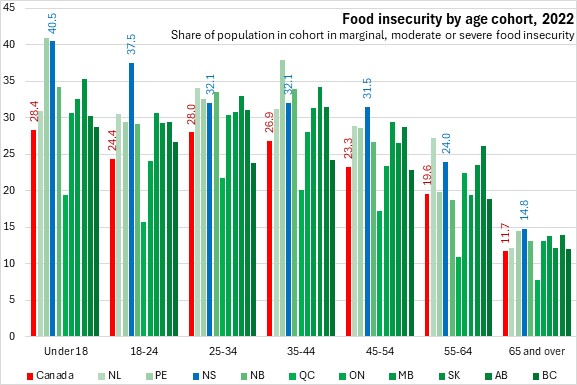
In Nova Scotia, 71.1% of the population was classified as 'food secure' in 2022. This was below the national average. Food security was highest in Québec and lowest in Nova Scotia.
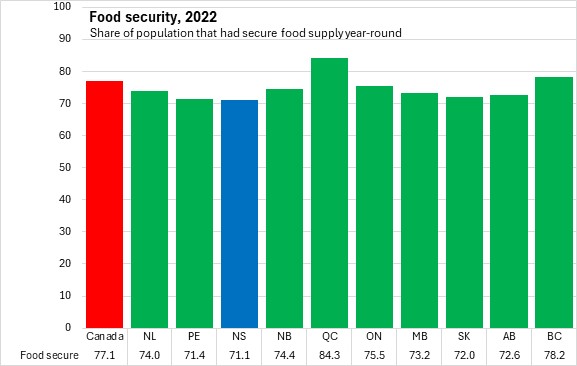
Food insecurity in Nova Scotia was 28.9%. Food insecurity is categorized as: marginal, moderate or severe. Nova Scotia's marginal food insecurity was close to the national average (6.0% nationally vs 6.1% in Nova Scotia) while moderate and severe food insecurity in Nova Scotia were above the national average.
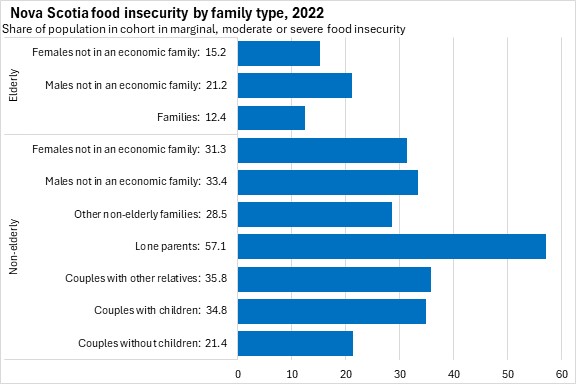
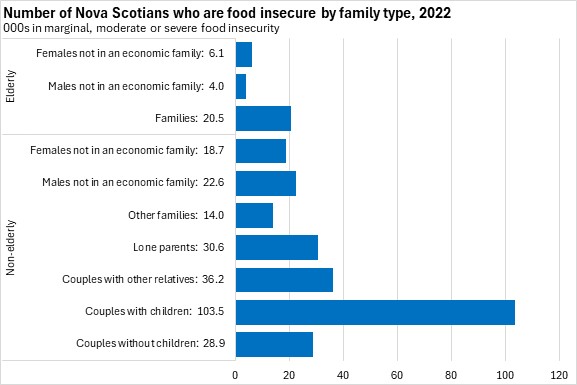
Food security was strongest for elderly persons (whether in economic families or not) as well as for non-elderly couples without children.
Food insecurity was highest for Nova Scotia's lone parent families (57.1%) as well as for couple families with children (34.8%) and non-elderly persons not in an economic family (32.5%).
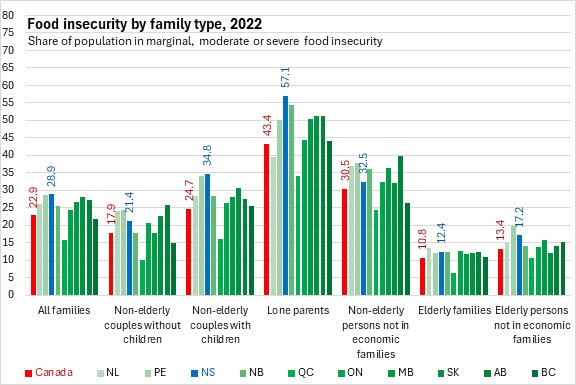
Although the portion of couple families with children that experience food insecurity was lower than for lone-parent families, this is a much larger cohort of the population and accounts for the largest cohort of persons living with food insecurity.
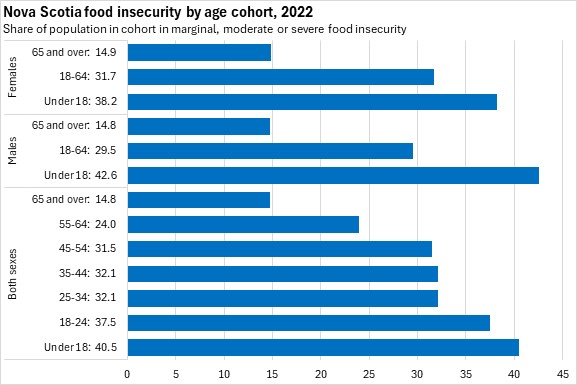
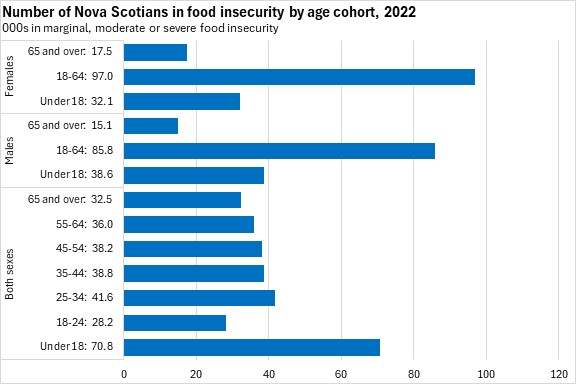
Food insecurity in Nova Scotia was highest for those under 18 years old as well as for those aged 18-24. Food insecurity diminished with age.
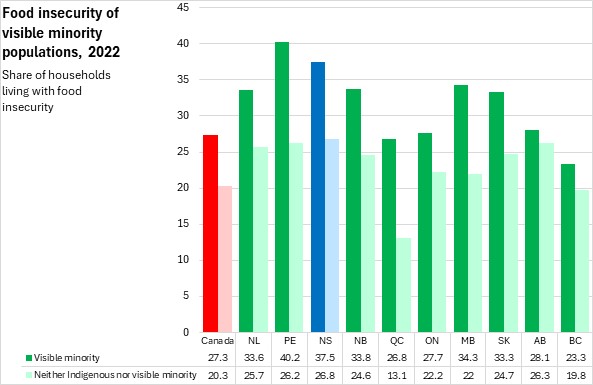
The gap in food insecurity between visible minority populations (37.5%) and those who identify neither as Indigenous nor a visible minority (26.8%) is larger than the national gap. Quebec reported the largest gap in food insecurity between visible minority populations and those who identified neither as Indigenous nor a visible minority. Alberta reported the smallest gap in food insecurity.
Sources: Statistics Canada, Canadian Income Survey. Table 13-10-0835-01 Food insecurity by selected demographic characteristics; Table 13-10-0834-01 Food insecurity by economic family type BUSINESS AND EMPLOYMENT DYNAMICS, 2021
Statistics Canada has released the 2021 results for provincial and territorial business and employment dynamics. This covers incorporated and unincorporated businesses in the private sector that issue at least one T4 slip in any given calendar year, but excludes self-employed individuals or partnerships where the participants do not draw salaries.
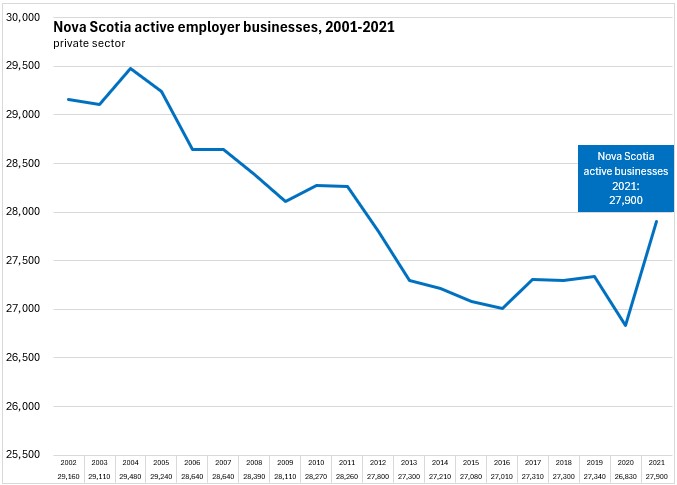
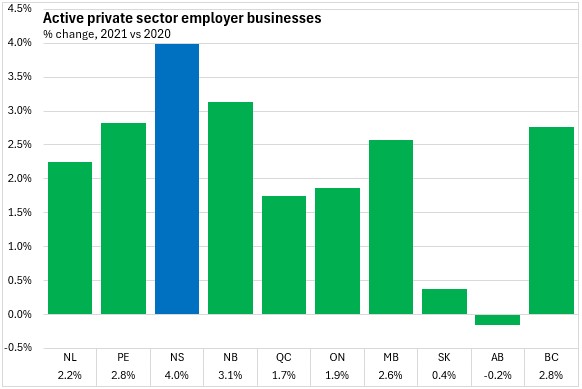
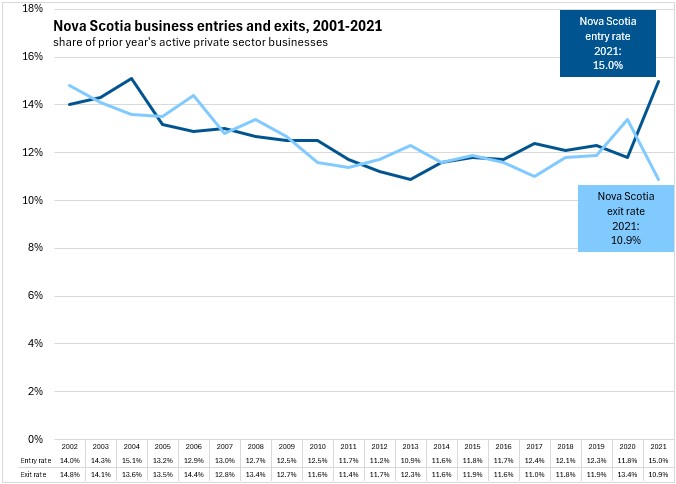
Following active business reductions in the early stages of the pandemic, the number of active employer businesses in Nova Scotia rose by 1,070 (+4.0%) to 27,900 in 2021 - the highest number of active businesses since 2011.
Among provinces, Nova Scotia reported the fastest growth in active private sector employer businesses in 2021. Alberta was the only province to report a decline in active private sector employer businesses from 2020 to 2021.
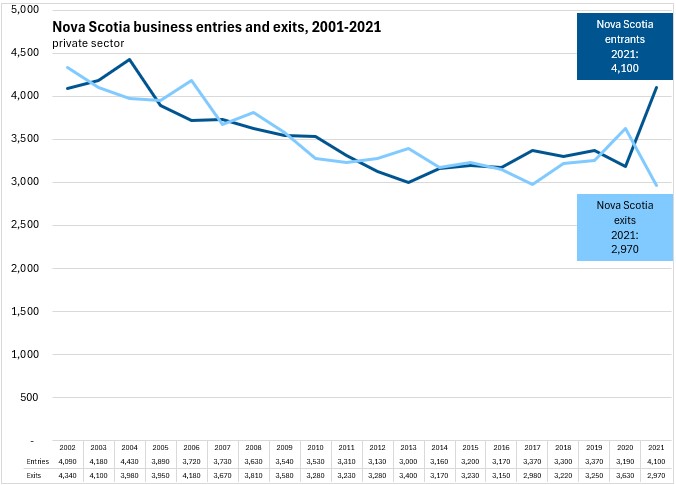
Among the 27,900 active private sector businesses, there were 23,800 incumbent businesses (continuing operations from previous years) as well as 4,100 new entrants. This was offset by exit of 2,970 firms from the numbers of previous incumbents. Entrants in any given year are enterprises that have current payroll data, but that did not have payroll data in the previous year. Similarly, exits in any given year are identified by the absence of current payroll data, where such data had existed in the previous year.
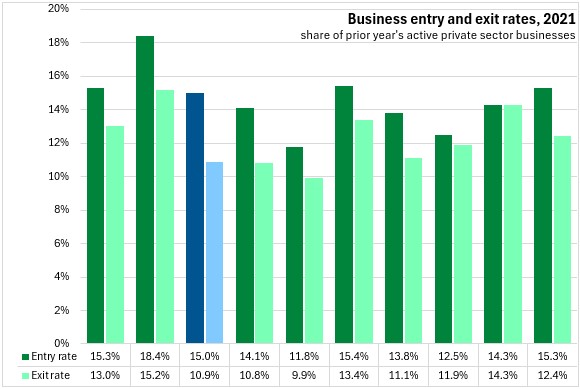
Measured in percentage terms (relative to an average of prior and current year totals), the entry rate for new firms rose to 15.0% in 2021, up from from 11.8% in 2020. The exit rate for firms fell to 10.9% in 2021, down from 13.4% in 2020.
All provinces reported higher entrants than exits in 2021. Prince Edward Island reported the highest rates for both business entry and business exit. Quebec reported the lowest business entry and business exit rates. Alberta and Saskatchewan reported the smallest gaps between exit and entry rates while Nova Scotia reported the largest gap between exit rates and entry rates.
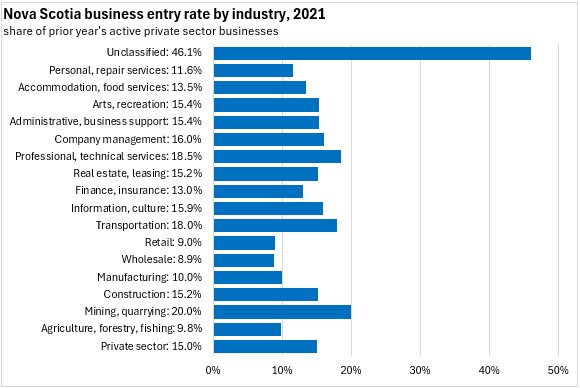
By industry, unclassified businesses accounted for a notably faster entry rate. Among classified industries, the fastest entry rates were reported in mining/quarrying, professional/technical services and transportation. Entry rates were slowest in wholesale, retail and agriculture/forestry/fishing.
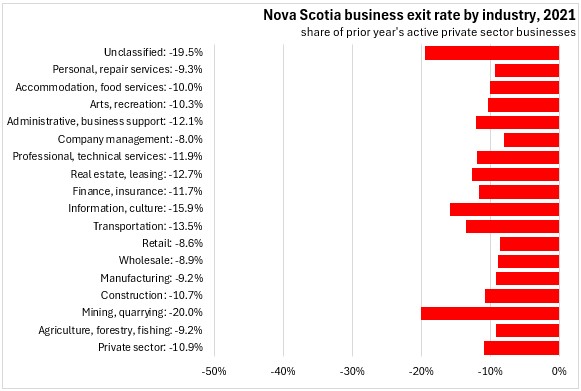
The fastest exit rates were also reported among unclassified businesses as well as mining/quarrying. The slowest exit rates were observed in company management and retail.
Statistics Canada's business employment dynamics data also examines employment changes in the private sector. In 2021, there was net private sector employment creation of 7.5% in Nova Scotia, representing gross employment creation of 15.8% against gross employment destruction of 8.3%.
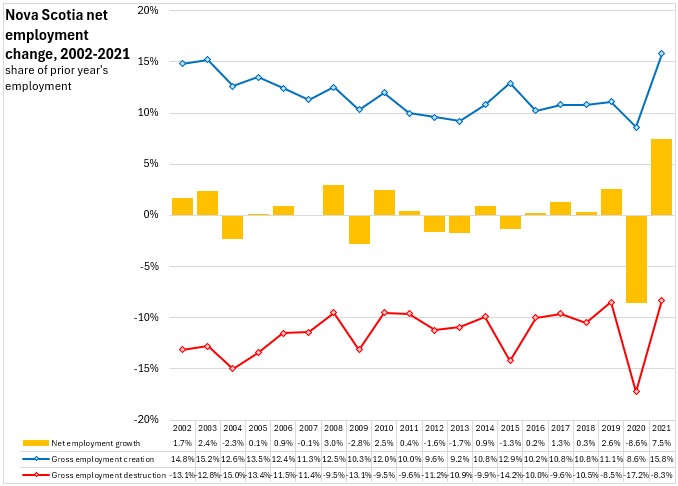
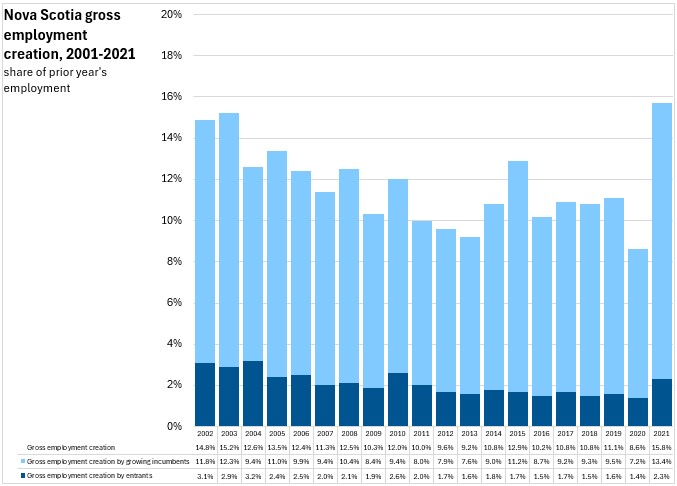
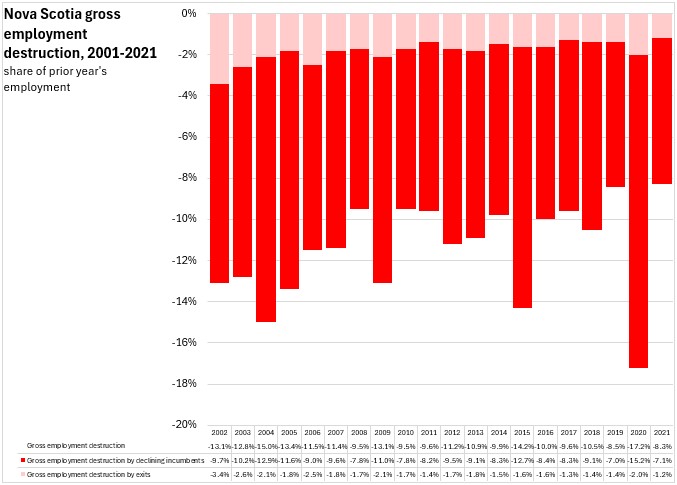
Net employment growth is broken down into four subcomponents of gross employment creation and destruction: employment creation by entrants (2.3%), employment creation by growing incumbents (13.4%), employment destruction by exits (1.2%), and employment destruction by declining incumbents (7.1%).
In all years since 2000, most net private sector employment change is explained by employment creation or destruction by incumbents rather than by new entrants or exiting firms.
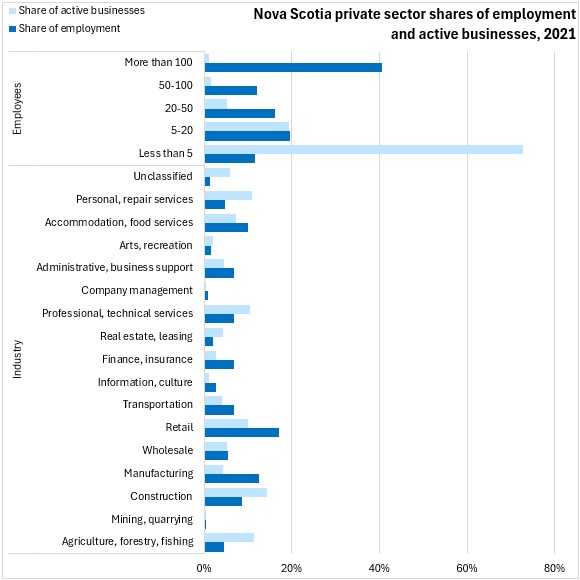
The contribution that each industry makes to overall employment dynamics depends on its share of overall employment and its gross employment creation or destruction. Industries such as manufacturing, retail, wholesale, finance/insurance, administrative and support services, information and culture, and accommodation/food account for a larger share of total employment than their share of active businesses (indicating a larger number of employees per business). Agriculture/forestry/fishing, construction, personal/repair services and professional/technical services are examples of industries with a greater share of active businesses than their share of employment (fewer employees per business).
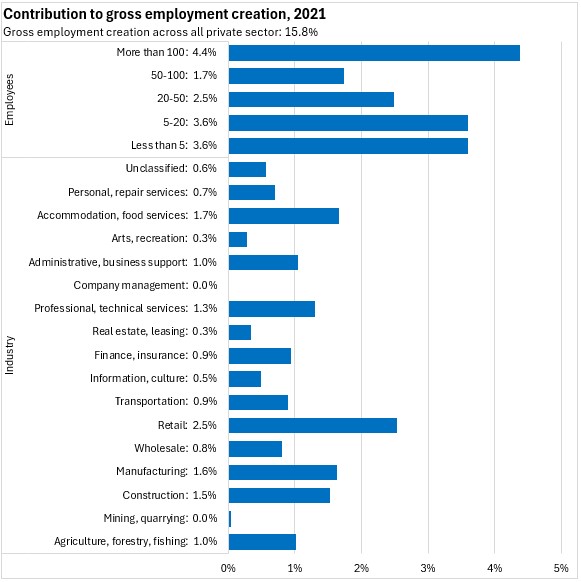
The share of businesses by firm size (as measured by number of employees) is highest for those firms employing fewer than 5 people. However, these small firms account for 11.6% of private sector employment. In contrast, firms with over 100 employees make up just 1.1% of all firms in Nova Scotia, but employ 40.6% of private sector employees.
Net employment creation was strongest among unclassified businesses. Among identified industries, net private sector employment growth was strongest in agriculture/forestry/fishing, information/culture, arts/recreation and professional/technical services. Only company management and mining/quarrying reported net employment declines.
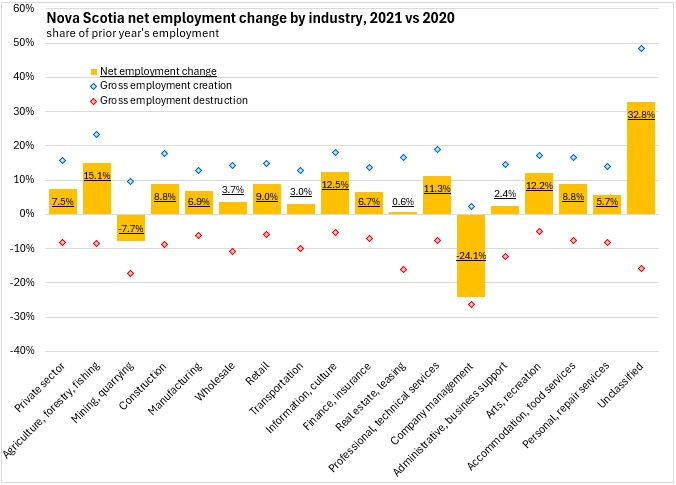
Among industries, the largest contributions to Nova Scotia's gross employment creation in 2021 (15.8%) came from retail, accommodation/food services, manufacturing and construction. By employment size, private sector businesses with over 100 employees made the largest contribution to gross employment creation.
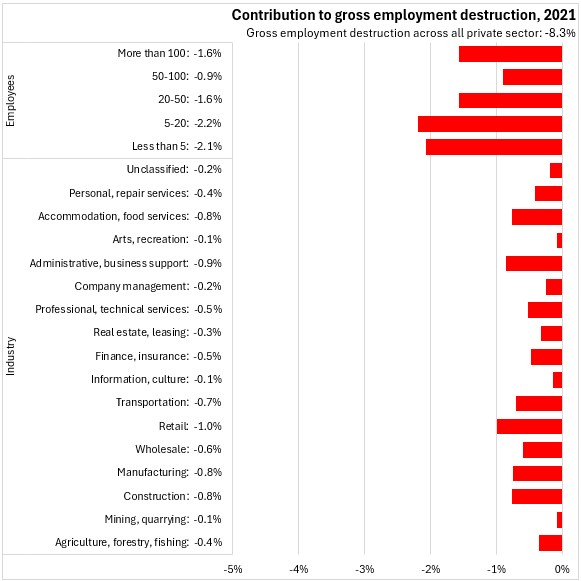
Among industries, retail and administrative/business support services (including call centres) had the largest contributions to Nova Scotia's private sector gross employment destruction in 2021 (-8.3%). By size of employment, businesses with between 5 and 20 employees made the largest contribution to gross employment destruction in Nova Scotia in 2021.
Source: Statistics Canada. Table 33-10-0087-01 Business Dynamics measures, by industry, per province or territory; Table 33-10-0088-01 Business Dynamics measures, by firm size, per province or territory; Table 33-10-0090-01 Business Sector employment flow rates by firm size, provinces and the territories; Table 33-10-0089-01 Business Sector employment flow rates, by industry, provinces and the territories; Table 33-10-0091-01 Contribution to private sector employment, gross employment creation and destruction, by Industry, per province or territory; Table 33-10-0093-01 Contribution to private sector employment, gross employment creation and destruction by firm size, provinces and the territories
|