To view previous releases, select one from the dropdown box:
Currently displaying information released on: May, 2026
TOURISM SATELLITE ACCOUNT, 2022
Statistics Canada has updated the Provincial and Territorial Satellite Account, a measure of the size of provincial tourism as measured by expenditures, GDP and employment. The Provincial and Territorial Tourism Satellite Account contains some important definitions. "Tourism industries" are industries which would cease to exist or would exist at significantly reduced levels of activity in the absence of tourism (e.g. air transportation, accommodation). "Tourism products" are those for which a significant part of their total demand comes from tourists. Tourism expenditures also include spending by tourists on other products that are not considered to be tourism products.
Data collection and tourism activity itself were distorted in 2022 by the COVID-19 pandemic and associated restrictions on travel.
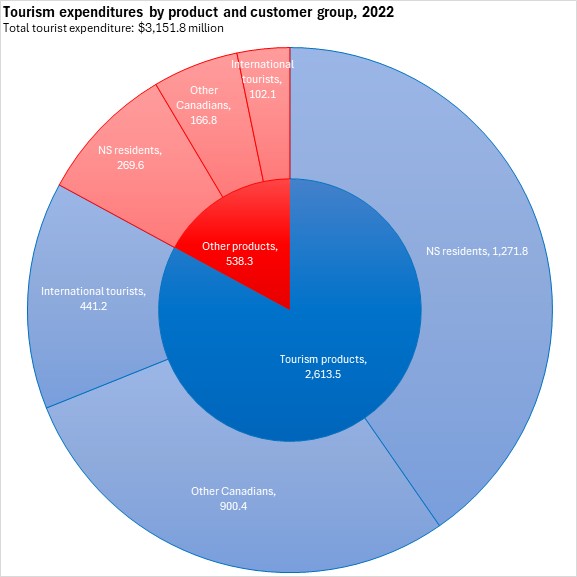
In Nova Scotia's Tourism Satellite Accounts for 2022, there was $3.1518 billion in tourism expenditures in the province. Tourism products accounted for $2.6135 billion while other products purchased by tourists amounted to $538.3 million.
Nova Scotia residents spending within the province were the largest part of tourism expenditures. Domestic tourism expenditures were $1.5414 billion in 2022: $1.2718 billion on tourism products along with $269.6 million on other products.
Visitors to Nova Scotia from other provinces spent $1,067.2 million in 2022: $900.4 million in tourism products and $166.8 million in other products.
International visitors to Nova Scotia made $543.3 million in tourism expenditures in 2022: $441.2 million in tourism products and $102.1 million in other products.
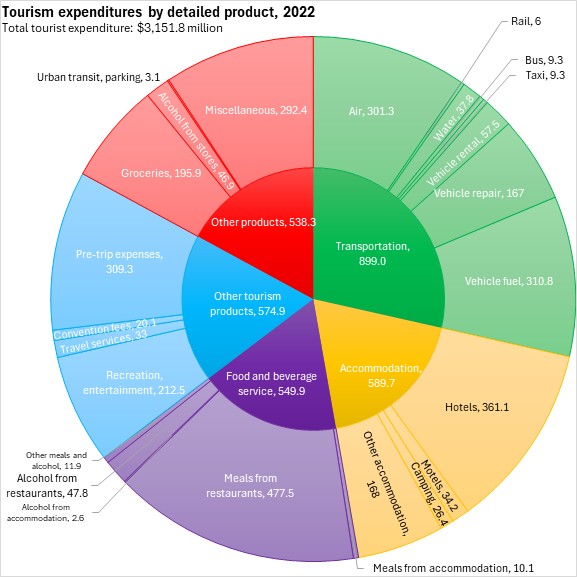
Tourism products can be broken down into four main categories: transportation, accommodations, food and beverage services and other tourism products. The largest parts of transportation expenditures were air travel and vehicle fuel, followed by vehicle repair/parts and vehicle rentals. Hotels made up the largest part of accommodation expenditures while restaurant meals make up the bulk of food and beverage service expenditures. Recreation and entertainment spending along with pre-trip expenses were the largest tourism product categories outside of transportation, accommodation and food/beverage services. Among specific tourism-related "other products", groceries were the largest individual item.
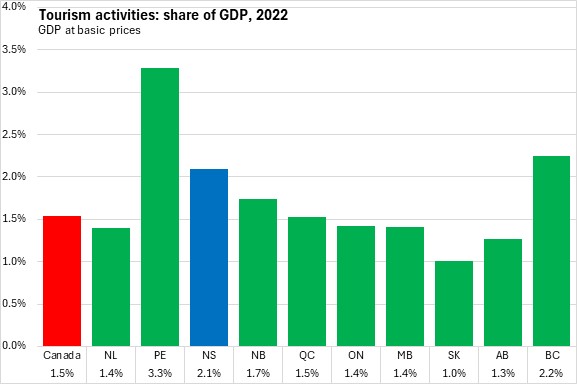
Tourism expenditures of $3.1518 billion generated Gross Domestic Product (GDP) of $1.0651 billion, which was 2.1% of Nova Scotia's total GDP in 2022. Across Canada, tourism GDP accounted for an average of 1.5% of GDP. Tourism share of GDP was highest in Prince Edward Island and British Columbia (followed by Nova Scotia). The lowest share of tourism in GDP was in Saskatchewan.
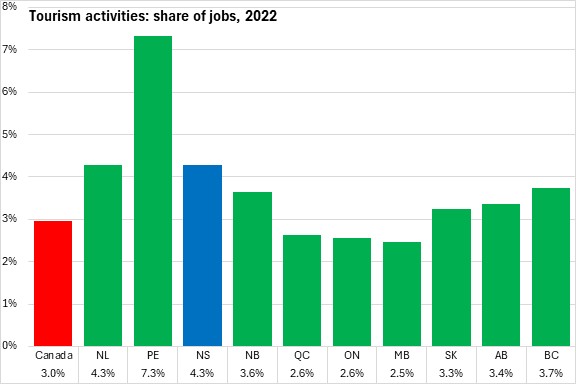
Tourism accounted 4.3% of total employment in 2022 - tied with Newfoundland and Labrador for second highest among provinces. This employment figure includes both full time and part time employment. Nationally, tourism accounted for 3.0% of employment. As with GDP, tourism had the highest portion employment in Prince Edward Island, followed by Nova Scotia and Newfoundland and Labrador. Tourism as a share of employment was lowest in Manitoba, Ontario and Québec.
Tourism jobs accounted for 2.6% of Nova Scotia's labour income (third highest after Prince Edward Island and British Columbia). Tourism generated 1.9% of national labour income.
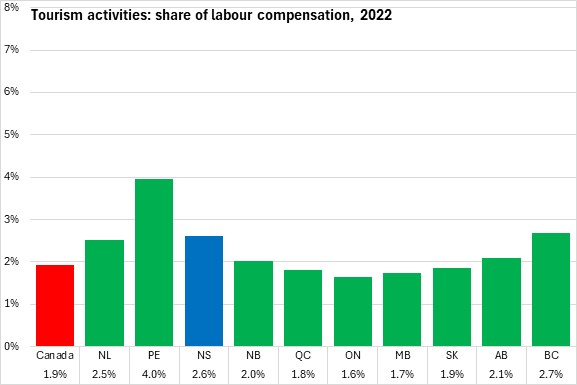
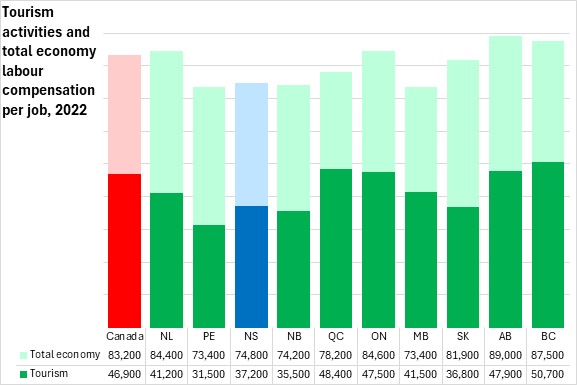
Part time and lower wage employment is more common in tourism industries than in the rest of the economy. Average labour income per tourism job was $37,200 in Nova Scotia, about 50% of the provincial average labour income per job.
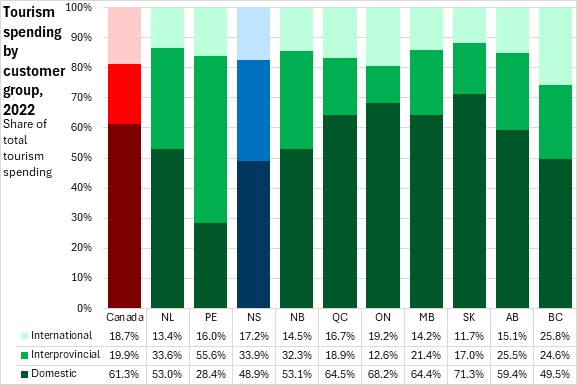
Domestic Demand (travel by residents from within a province) accounted for just under half of tourism product spending (48.9%), with the balance made up between interprovincial exports (visitors from another province in Canada: 33.9%) and international exports (visitors from another country: 17.2%).
The domestic share of tourism expenditures was highest in Saskatchewan. The lowest domestic share of tourism expenditure was in Prince Edward Island.
The interprovincial shares of tourism expenditures were highest in Prince Edward Island and lowest in Ontario.
International share of tourism expenditure was highest in British Columbia. The lowest shares of international expenditures in tourism were in Saskatchewan.
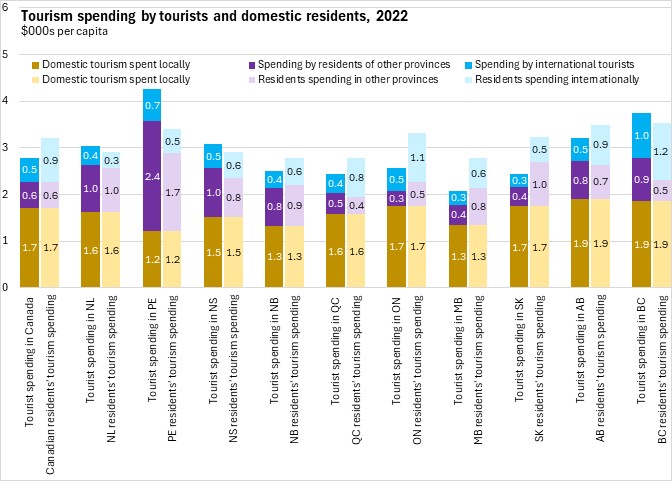
Looking at tourism expenditures by residents of each province, only Newfoundland and Labrador, Nova Scotia, Prince Edward Island and British Columbia reported more inbound tourism spending per capita than outbound tourism spending by residents.
Source: Statistics Canada. Table 24-10-0004-01 Provincial and territorial tourism supply and expenditure (x 1,000,000); Table 24-10-0042-01 Provincial and territorial gross domestic product (GDP) and employment generated by tourism and related measures (x 1,000,000); Table 24-10-0044-01 Interprovincial tourism expenditures (x 1,000,000) BUSINESS OPENING AND CLOSING, FEBRUARY 2026
Monthly (January vs February 2026, seasonally adjusted)
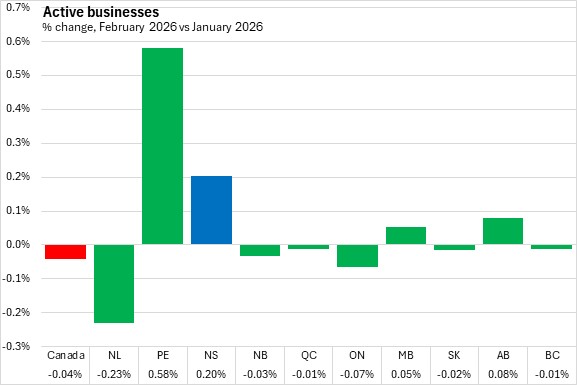
The number of active businesses in Nova Scotia increased by 0.2% from January to February 2026, rising by 43 to 21,118 active businesses.
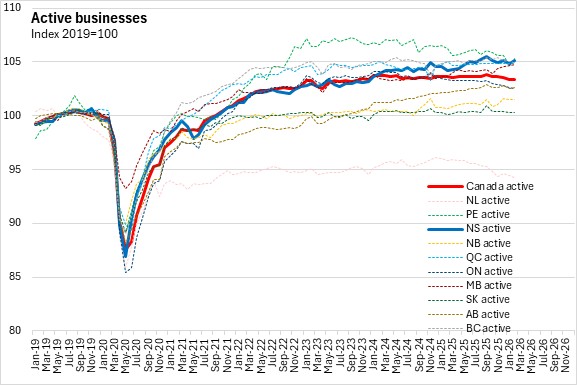
Nationally, active businesses were down 0.04%, with declines in six provinces, led by Newfoundland and Labrador. Prince Edward Island reported the fastest increase in active businesses.
A business will be classified as 'opening' if it had no employment in the previous month and then has employment in the next month. A business is 'closing' if it had employment in the previous month and no employment in the current month. For opening and closing, the reason could be a permanent change (i.e. business exit) or temporary for reasons such as seasonal operations, capital maintenance or restructuring. Continuing business are those that had employment in both the current and previous month. Active businesses are the sum of continuing and opening business in the current month.
The rate at which business either opened, continued or closed can be examined to see how the number of active businesses has changed. The calculation for the opening, continuing and closure rates are based on the number of active businesses in the previous month.
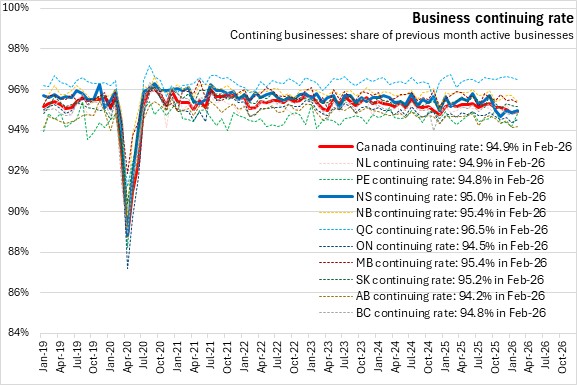
Most businesses continue operating each month. In February 2026, Nova Scotia's business continuing rate was 95.0%, just above the national average (94.9%). Québec reported the highest business continuing rate (96.5%) while Alberta reported the lowest continuing rate (94.2%).
Nova Scotia's business opening rate was 5.2% (just above the national rate 5.0%) in February 2026, up from the previous month. Alberta and Prince Edward Islnad had the highest business opening rates (5.8%) while Québec had the lowest (3.6%).

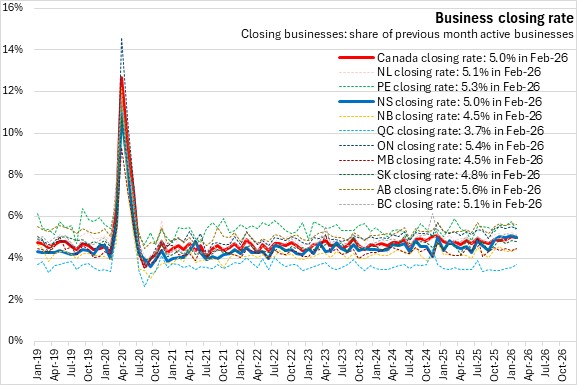
Nova Scotia's business closing rate was 5.0% in February 2026, the same as the national average. Alberta reported the highest business closing rate (5.6%), while Québec had the lowest business closing rate (3.7%).
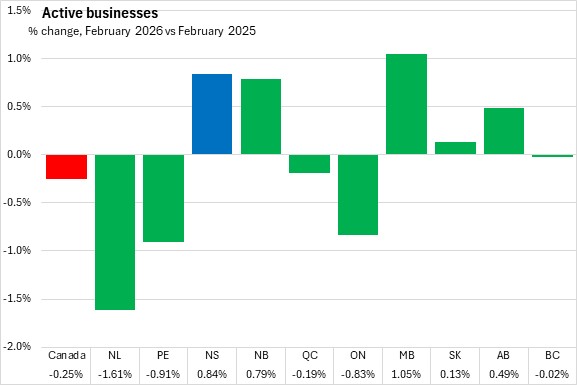
Year-over-year (February 2026 vs February 2025)
Compared with February 2025, the number of active businesses was up 0.84% for Nova Scotia. Nationally, active businesses decreased 0.25% compared to February 2025. Manitoba reported the fastest year-over-year increase in active businesses, while Newfoundland and Labrador had the largest decline.
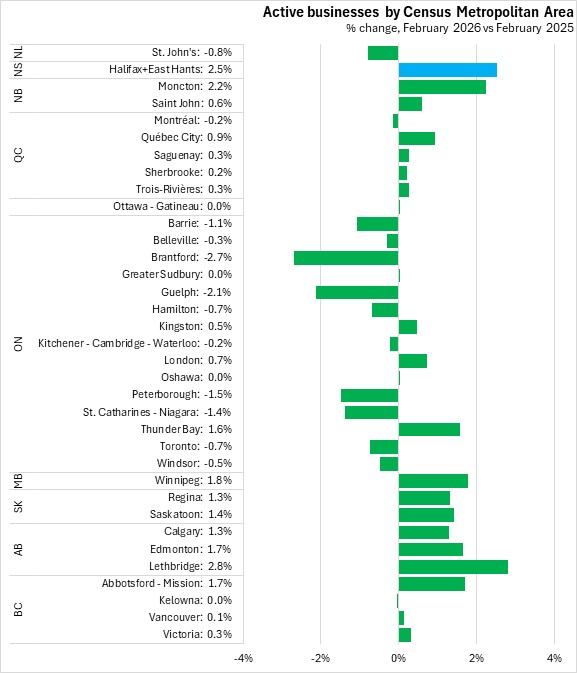
The number of active businesses in the Halifax and East Hants Census Metropolitan Area was up 2.5% from February 2025 to February 2026, the second-fastest increase among CMAs.
Out of 35 CMAs, 22 reported growth in active businesses over the past 12 months, with Lethbridge reporting the fastest increase. The largest decline in active businesses was in Brantford.
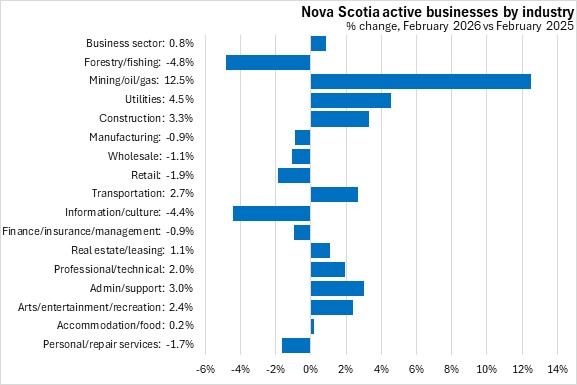
Compared with February 2025, nine sectors saw an increase in active businesses in Nova Scotia in February 2026 with the largest percentage increase in mining/oil/gas. The steepest decline was in forestry/fishing.
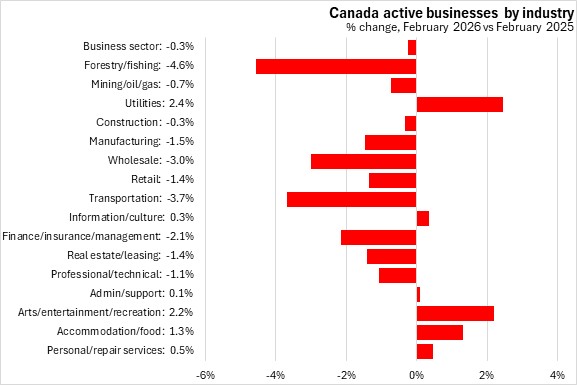
Nationally, the number of active businesses was down for ten of sixteen business sectors. The largest gain was in utilities, while the largest declines were in forestry/fishing.
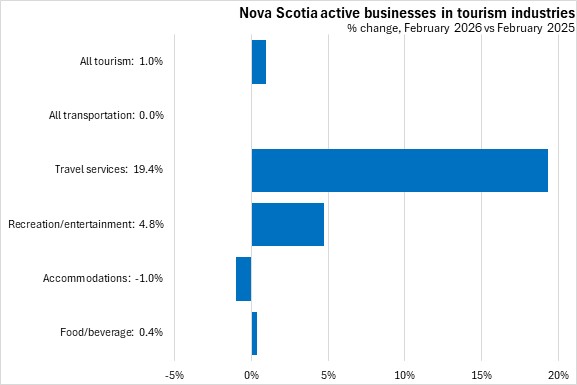
Statistics Canada has broken out specific data for tourism-related industries. Compared with February 2025, the number of active tourism-related businesses increased 1.0% in Nova Scotia as of February 2026, with gains in all subsectors except accommodation (fastest: travel services).
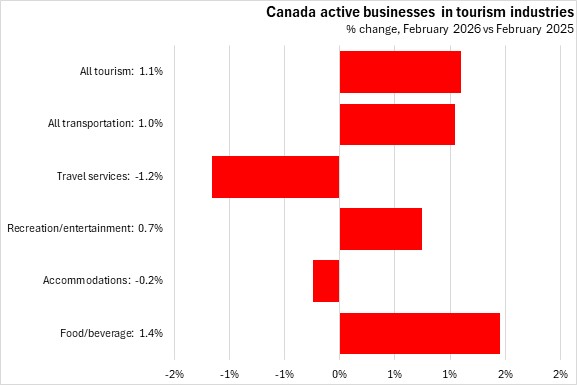
Nationally the number of tourism-related businesses was up 1.1% from February 2025 to February 2026, with transportation, food/beverage and recreation/entertainment gains offsetting a decline in travel services and accommodations.
Trends
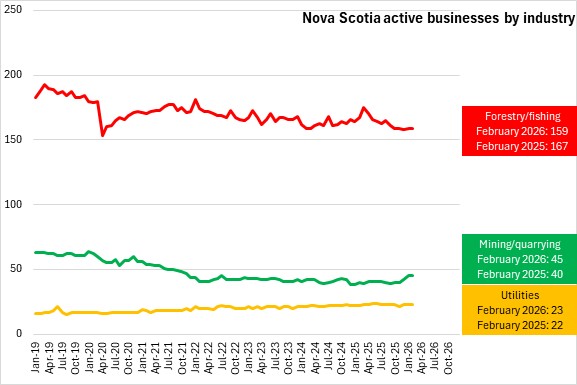
There has been a downward trend in forestry/fishing active businesses, but in the three months prior to April 2025 there was a substantial rise in active businesses, which then subsided to the previous trend. Since the fourth quarter of 2025, the number of active business in forestry/fishing has stabilized. Mining/quarrying has been steadily declining, but increased in recent months. Utilities has been growing steadily in recent years.
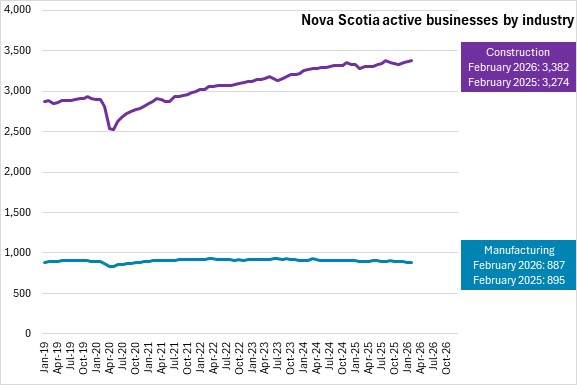
From 2020-2025, the number of active businesses in construction grew at a steady pace despite a slight dip in the end of 2024 and in recent months. Manufacturing businesses have slowly declined over the past two years.
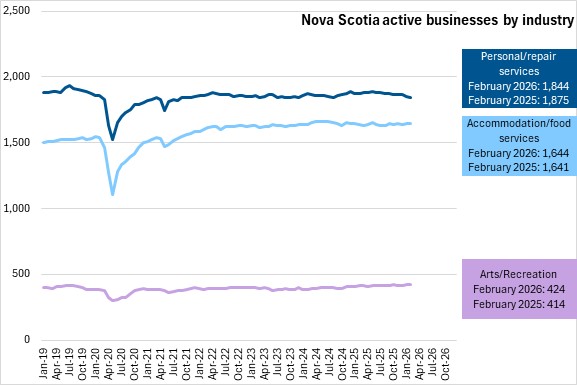
Personal/repair have declined, while accommodation/food services and arts/recreation business counts have been relatively stable in recent months.
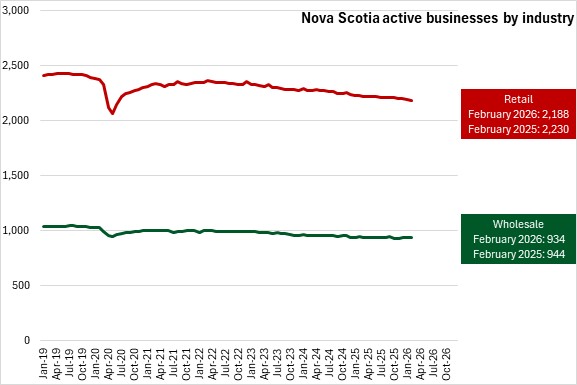
Retail and wholesale businesses have declined steadily in recent years.
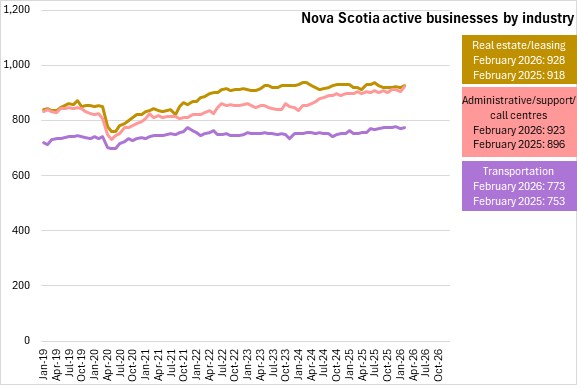
Active businesses in transportation have been rising slowly since early 2025, plateauing in recent months. The number of active businesses in real estate/leasing have grown after a dip in recent months. Active businesses in administrative/support/call centers have grown since 2024.
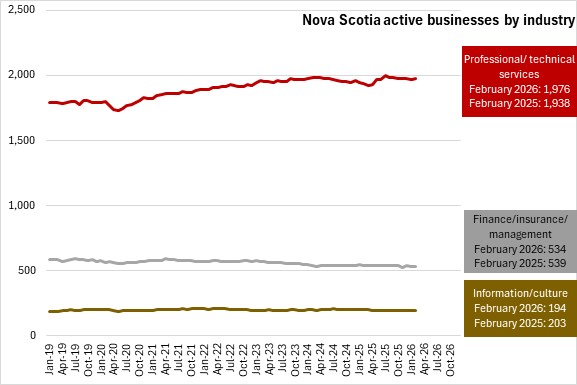
Professional/technical services active businesses have grown in 2025, but this growth tapered off in the most recent months. Finance/insurance/management businesses as well as businesses in information/culture have been stable.
The source data is seasonally adjusted. The data may not aggregate due to firms being classified into multiple industry or geography.
Source: Statistics Canada. Table 33-10-0270-01 Experimental estimates for business openings and closures for Canada, provinces and territories, census metropolitan areas; Methodology: Business Opening and Closing
|