June 19, 2017STUDY: THE IMPACT OF AGING ON LABOUR MARKET PARTICIPATION RATES Statistics Canada released a study last week looking at the impacts of the aging population on overall labour force participation rates in Canada using annual Labour Force Survey data from 1976 to 2016. Participation rates (the ratio of those in the labour force to the total working age population) have been declining in recent years, with the Canadian rate reaching its lowest level in 17 years in 2016, 65.7 per cent. The study notes that this overall decline has largely been the result of two factors. For almost every age group (i.e. holding age constant) participation rates have risen from 1976 to 2016, especially among the oldest age groups. However, the older age groups still have significantly lower participation rates and the aging of the relatively large baby boom cohort ages beyond 55 years of age has outweighed that increase in recent years, bringing the overall average participation rate down.
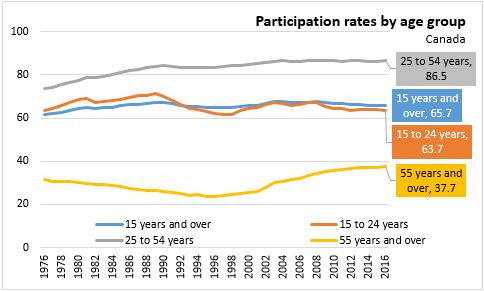
Participation Rates by Age Group
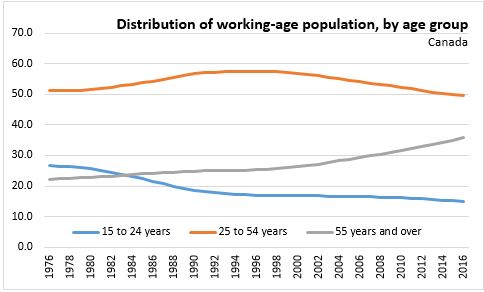
Within age groups, the participation rate has generally trended upward over the past two decades or more, with the exception of the 15 to 24 age group. Among the prime working age group (25 to 54) in Canada the participation rate has steadily increased since 1976, driven in particular by the increase in labour force participation among women, and flattened in more recent years. Among those age 55 years and over, the participation rate has climbed significantly since the late 1990s, increasing from 24 per cent in 1996 to 38 per cent in 2016. The 15 to 24 year old age group has generally had a more variable participation rate over time, affected moreso by things like business cycles and recessions, as well as other factors like trends in educational attainment.
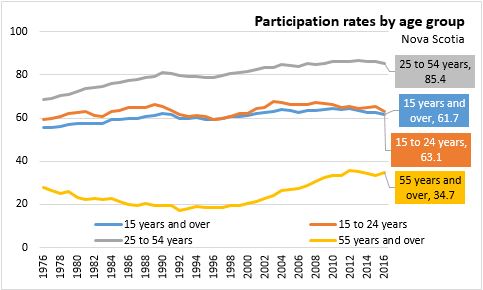
In Nova Scotia, overall trends in the participation rate by age group have been similar to Canada's from 1976 to 2016. The rate among the prime working age group has more or less steadily increased over that period, flattening out in more recent years, with a rate of 85.4 per cent in 2016, similar to the Canadian rate of 86.5 per cent. The participation rate among those age 55 and over in Nova Scotia has also followed a similar trend to their Canadian counterparts, with the rate declining into the mid-1990s and then sharply increasing. In Nova Scotia the participation rate among those 55 and over increased from 18.4 per cent in 1996 to 34.7 per cent in 2016. Though it has followed a similar trend to the Canadian rate for that age group, the participation rate for Nova Scotians has generally trailed the national rate for this age group. Finally, among 15 to 24 year old Nova Scotians, the participation rate has followed broadly similar trends to that of their Canadian counterparts, reaching 63.1 per cent in 2016 compared to 63.7 per cent among Canadians in that age group.
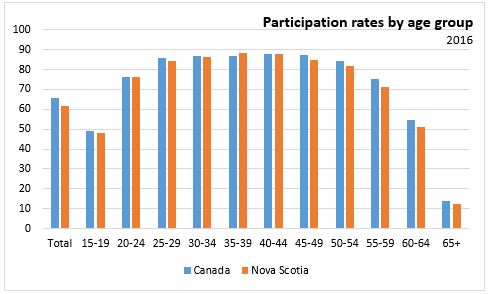
The chart below shows participation rates by five-year age groups and the total population for Canada and Nova Scotia in 2016. As can be seen, the participation rates within age groups do not differ substantially between Canada and Nova Scotia, though there is a bit more of a gap within the 45 to 49 age group and above.
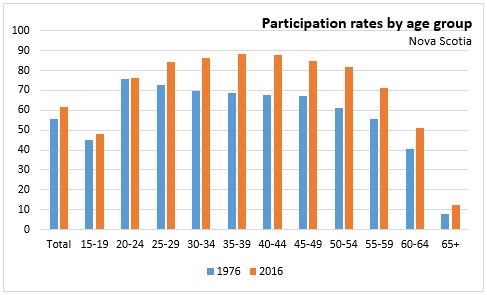
The chart below shows a more detailed look at how the participation rate in Nova Scotia by age group has changed from 1976 to 2016. The rate has increased in every age group.
The Aging Workforce
From 1976 to 2016, the age composition of the Canadian and Nova Scotian labour force have changed significantly. As of 2016, individuals age 55 and over accounted for 36 per cent of the Canadian working-age population, the highest proportion on record (since 1976). Statistics Canada projects that proportion could reach 40 per cent by 2026. Largely this reflects the aging of the relatively large baby boom cohort beyond the age of 55, with the 55 and over age group increasing at the same time that the 25 to 54 age group is decreasing. At the same time, declining birth rates have contributed to a decreasing proportion of 15 to 24 year olds in the working-age population.
Nova Scotia has experienced similar trends in its workforce over this time period, though somewhat more pronounced. As of 2016, individuals age 55 and over accounted for 41 per cent of the Nova Scotian working-age population, compared to 36 per cent nationally. The prime working-age population fell to 45.5 per cent in Nova Scotia, compared to 49.4 per cent nationally. Those age 15 to 24 accounted for 13.9 per cent of the Nova Scotia working-age population, just behind 14.8 per cent at the national average.

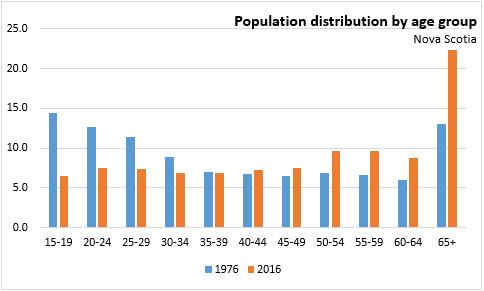
The chart below shows a more detailed breakdown of the change in the age distribution of the Nova Scotia working-age population from 1976 to 2016. As can be seen, while the proportion of those 34 and under has declined, the proportion of older individuals has increased. That increase was especially pronounced among those 55 and older - the age groups for which participation rates drop off significantly compared to those in the 25 to 54 prime working-age group.
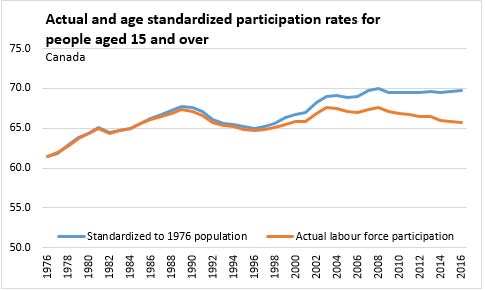
Statistics Canada's study produced estimates of what the Canadian participation rate trend would have looked like since 1976, if the age distribution of the population had not changed but rather had stayed exactly the same as it was in 1976. The chart below shows what that looks like. While the actual participation rate (in orange) was flat for much of the 2000s and declining since the recession, the age-standardized rate (in blue) would have continued to increase for most of that period, reflecting the growth in the participation rate within age groups.
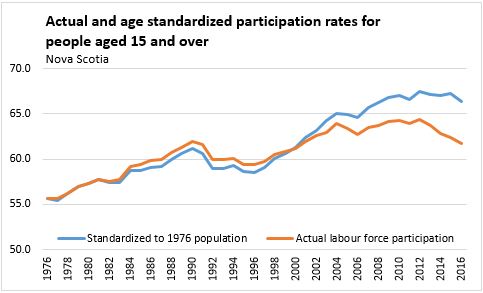
Below, we have recreated this same procedure for Nova Scotia. The actual participation rates (in orange) peaked in the mid-2000s and then again in 2011, and has declined since then. If however, population aging had not occured and the labour force had the same age distribution in 2016 as it did in 1976, the age-standardized participation rate (in blue) would have continued to increase until 2012 and remained relatively flat since then.
Source: Study: Impact of Aging on Labour Market Participation Rates | Report