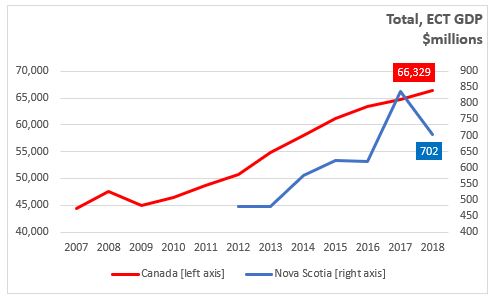
April 06, 2020ENVIRONMENTAL AND CLEAN TECHNOLOGICAL PRODUCT ACCOUNT, 2018 The Environmental and Clean Technology Products Economic Account measures the contribution to the Canadian economy of goods and services that reduce environmental impacts. Two broad categories of goods and services are recognized: environmental goods and services (including clean electricity, biofuels and primary goods, and waste management and remediation services), and clean technology goods and services (including manufactured goods, scientific and research and development services, construction services, and support services). In Nova Scotia the gross domestic product (GDP) generated by the environmental and clean technology (ECT) products sector declined 16.0 per cent to $702 million in 2018 as compared to 2017. The value of ECT GDP in 2017 was up 35.3 per cent. The national GDP generated by the ECT grew 2.5 per cent to $66.3 billion in 2018.
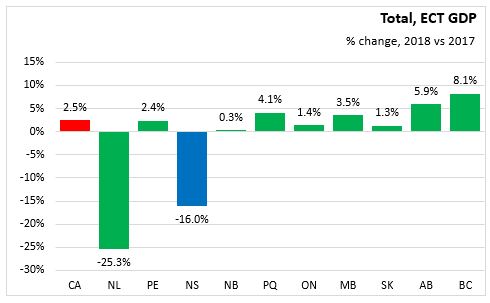
In 2018, total ECT GDP grew in eight provinces led British Columbia (+8.1 per cent) and Alberta (+5.9 per cent). ECT GDP declined in Newfoundland and Labrador (-25.3 per cent) and Nova scotia (-16.0 per cent).
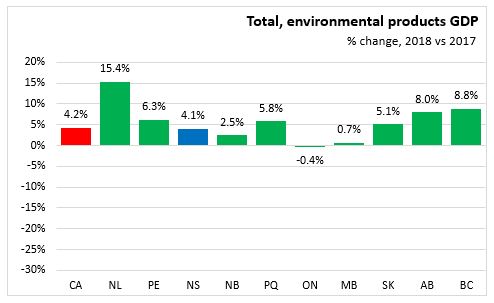
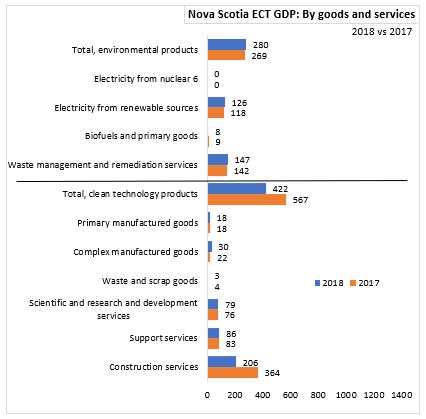
In 2018, Nova Scotia environmental products GDP increased 4.1 percent to $280 million and nationally increased 4.2 per cent compared to 2017. Environmental products GDP increased in all provinces except Ontario (-0.4 per cent). The highest growth was in Newfoundland and Labrador (15.4 per cent) followed by British Columbia (+8.8 per cent) and Alberta (+8.0 per cent).
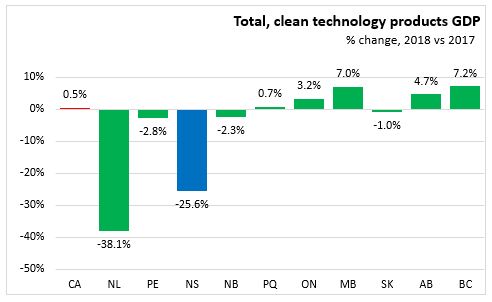
In 2018, Nova Scotia clean technology products GDP decreased by 25.6 per cent to $442 million and nationally increased 0.5 per cent compared to 2017. Clean technology products GDP increased in provinces led by British Columbia (+7.2 per cent) and Manitoba (+7.0 per cent). Clean technology products GDP declined in Newfoundland and Labrador (-38.1 per cent) followed by Nova Scotia (-25.6 per cent), New Brunswick (-2.3 per cent) and Saskatchewan (-1.0 per cent).
In 2018, over half (60.1%) of the Nova Scotia GDP from ECT products was attributable to the to the production of clean technology goods and services. There was an increase in 3 out of 6 clean technology products goods and services. The decline in Nova Scotia ECT in 2018 came from reduction in construction service activity for clean technology which rose from $140 million in 2016, to $364 million in 2017 and fell to $206 million in 2018.
The remaining 39.1% of national GDP from ECT products was attributable to the value of environmental goods and services. There was an increase in 2 out of 4 environmental products.
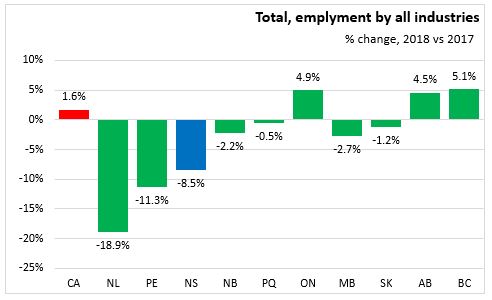
In 2018, Nova Scotia total employment in ECT activity was 5,518 and nationally was 317,085. Nova Scotia employment in ECT activity declined by 8.5 per cent and nationally increased 1.6 per cent compared to 2017. Total employment in ECT activity increased in 3 provinces led by British Columbia (+5.1 per cent), Ontario (+4.9 per cent) and Alberta (+4.5 per cent). Total employment in ECT activity declined the most in Newfoundland and Labrador (-18.9 per cent) followed by Prince Edward Island (-11.3) per cent, Nova Scotia (-8.5 per cent), and Manitoba (-2.7 per cent).
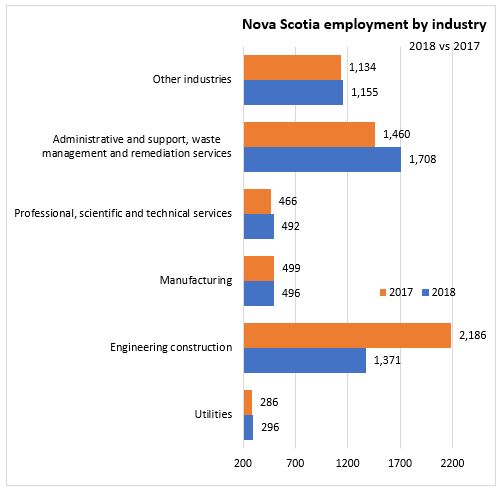
Nova Scotia employment in ECT increased in 3 out of 5 industries in 2018. The highest gain was in administrative and support, waste management and remediation services and the largest decline was in Engineering construction.
Statistics Canada. Table: 36-10-0627-01 Environmental and Clean Technology Products Economic Account, production account (x 1,000,000)
Table: 36-10-0632-01Environmental and Clean Technology Products Economic Account, employment