
Core Housing Need in the Provinces
Statistics last updated April 29, 2013.
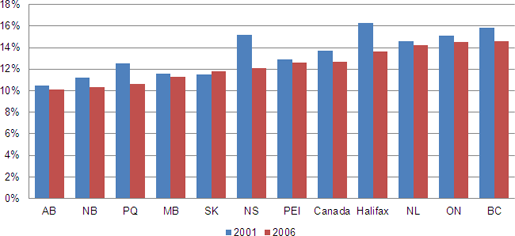
Core Housing Need, Canada and the Provinces, 2001 to 2006
Key Points
- In 2006, the proportion of households living in core housing need in Nova Scotia, 12.1%, was below the Canadian average of 12.7%.
- Between 2001 and 2006, Nova Scotia saw the largest drop in core housing need among all provinces.
| Core Housing Need, Canada and the Provinces | ||||||||
| Incidence of Core Housing Need | Number of Households in Core Housing Need | |||||||
| 1991 | 1996 | 2001 | 2006 | 1991 | 1996 | 2001 | 2006 | |
| Canada | 13.6% | 15.6% | 13.7% | 12.7% | 1,269,980 | 1,567,180 | 1,485,340 | 1,494,395 |
| NL | 14.5% | 14.8% | 14.6% | 14.2% | 24,630 | 26,310 | 26,605 | 27,305 |
| PEI | 13.4% | 13.4% | 12.9% | 12.6% | 5,585 | 6,060 | 6,200 | 6,435 |
| NS | 13.6% | 14.9% | 15.2% | 12.1% | 42,070 | 48,105 | 51,590 | 43,760 |
| NB | 16.2% | 13.6% | 11.2% | 10.3% | 39,405 | 34,735 | 29,990 | 29,360 |
| QC | 14.5% | 16.3% | 12.5% | 10.6% | 359,985 | 426,655 | 352,350 | 324,590 |
| ON | 11.9% | 16.1% | 15.1% | 14.5% | 408,035 | 594,250 | 599,660 | 627,530 |
| MB | 13.9% | 14.7% | 11.6% | 11.3% | 50,525 | 55,015 | 45,390 | 46,915 |
| SK | 14.9% | 12.6% | 11.5% | 11.8% | 45,410 | 39,685 | 37,160 | 40,835 |
| AB | 12.8% | 11.3% | 10.5% | 10.1% | 105,780 | 100,775 | 106,285 | 119,055 |
| BC | 15.6% | 17.4% | 15.8% | 14.6% | 182,505 | 228,970 | 223,675 | 221,475 |
| Source Canada Mortgage and Housing Corporation (CMHC), Canadian Housing Observer data tables "Housing Conditions and Core Housing Need" |
||||||||