To view previous releases, select one from the dropdown box:
Currently displaying information released on: June, 2026
BUSINESS OPENING AND CLOSING, MARCH 2026
Monthly (March vs February 2026, seasonally adjusted)
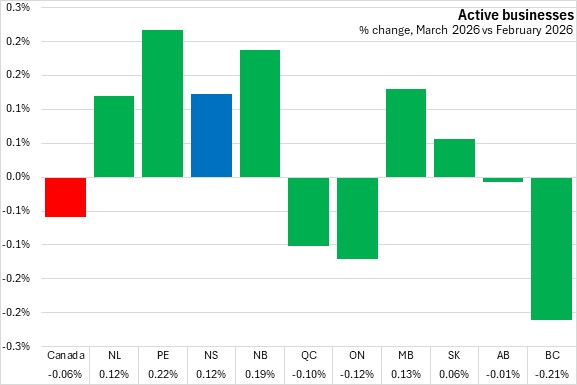
The number of active businesses in Nova Scotia increased by 0.12% from February to March 2026, rising by 26 to 21,151 active businesses.
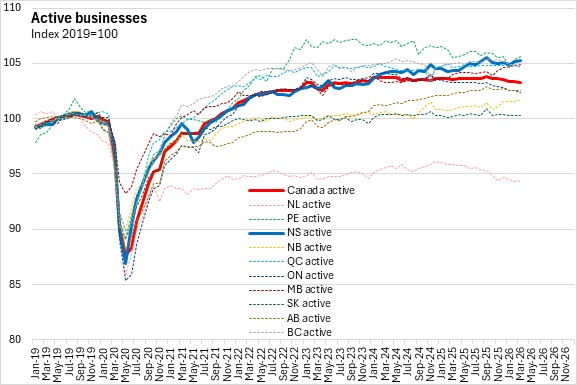
Nationally, active businesses were down 0.06%, through business counts were up in 6 provinces. Prince Edward Island reported the fastest monthly growth in active businesses while British Columbia reported the steepest decline.
A business will be classified as 'opening' if it had no employment in the previous month and then has employment in the next month. A business is 'closing' if it had employment in the previous month and no employment in the current month. For opening and closing, the reason could be a permanent change (i.e. business exit) or temporary for reasons such as seasonal operations, capital maintenance or restructuring. Continuing business are those that had employment in both the current and previous month. Active businesses are the sum of continuing and opening business in the current month.
The rate at which business either opened, continued or closed can be examined to see how the number of active businesses has changed. The calculation for the opening, continuing and closure rates are based on the number of active businesses in the previous month.
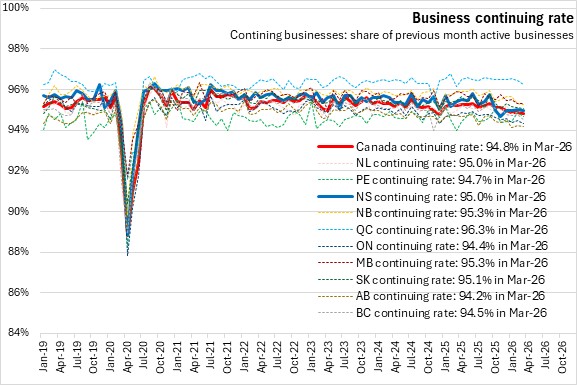
Most businesses continue operating each month. In March 2026, Nova Scotia's business continuing rate was 95.0%, just above the national average (94.8%). Québec reported the highest business continuing rate (96.3%) while Alberta reported the lowest continuing rate (94.2%).
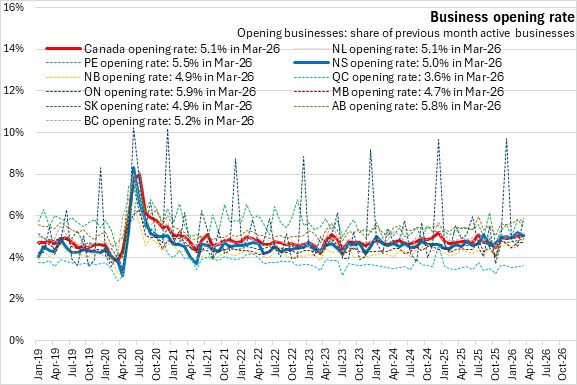
Nova Scotia's business opening rate was 5.0% (just below the national rate 5.1%) in March 2026. Ontario had the highest business opening rate (5.9%) while Québec had the lowest (3.6%).
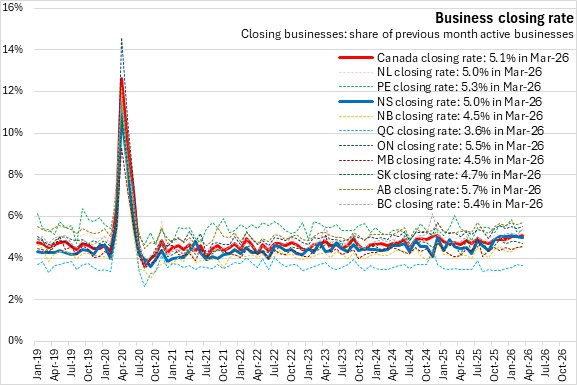
Nova Scotia's business closing rate was 5.0% in March 2026, just under the national average (5.1%). Alberta reported the highest business closing rate (5.7%), while Québec had the lowest business closing rate (3.6%).
Year-over-year (March 2026 vs March 2025)
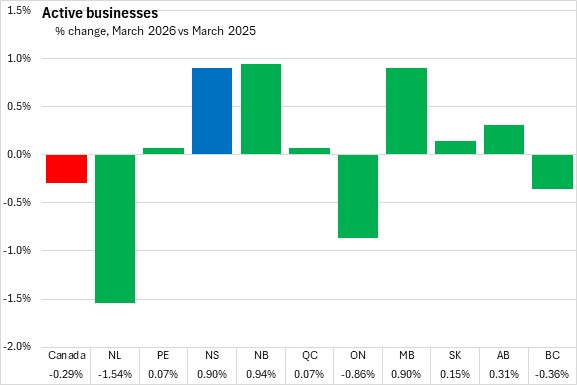
Compared with March 2025, the number of active businesses was up 0.90% for Nova Scotia - tied with Manitoba for the second fastest growth (after New Brunswick). Nationally, active businesses decreased 0.29% compared to March 2025. Newfoundland and Labrador had the steepest decline.
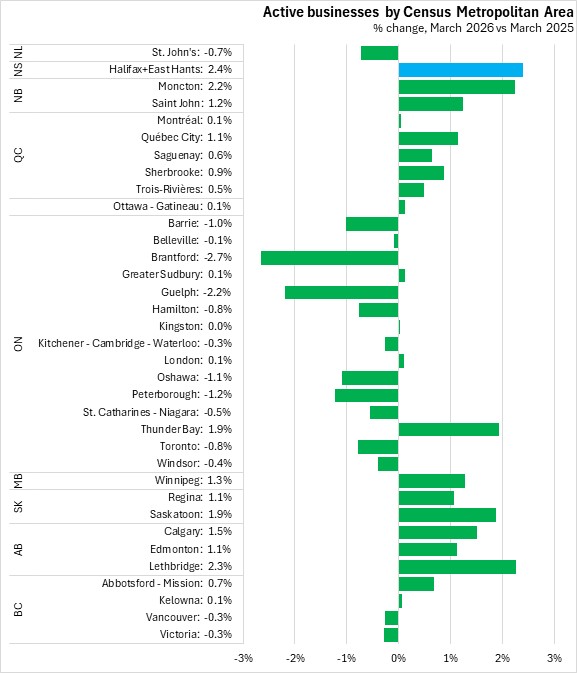
The number of active businesses in the Halifax and East Hants Census Metropolitan Area was up 2.4% from March 2025 to March 2026, the fastest increase among CMAs.
Out of 35 CMAs, 21 reported growth in active businesses over the past 12 months. The sharpest decline in active businesses was in Brantford.
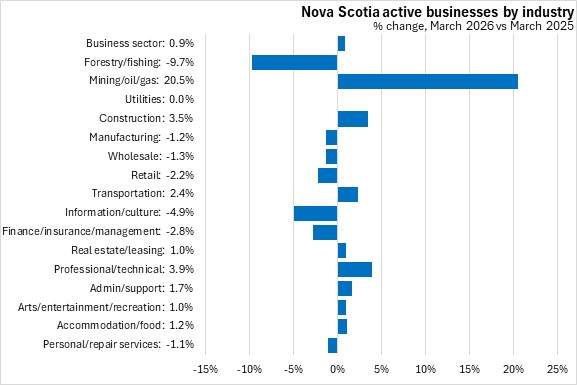
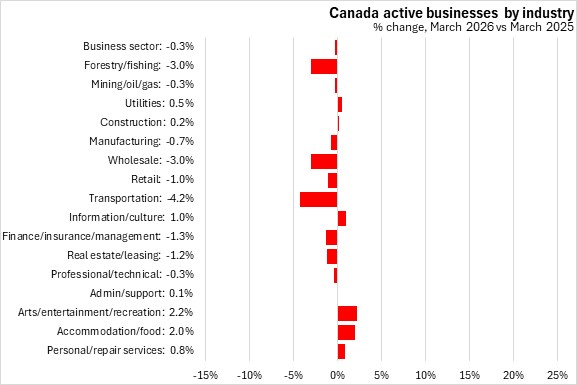
Compared with March 2025, eight sectors saw an increase in active businesses in Nova Scotia in March 2026 with the largest percentage increase in mining/oil/gas (though this is a small number of firms). The steepest decline was in forestry/fishing.
Nationally, the number of active businesses was down for nine of sixteen business sectors. The largest gain was in arts/entertainment/recreation, while the steepest decline was in transportation.
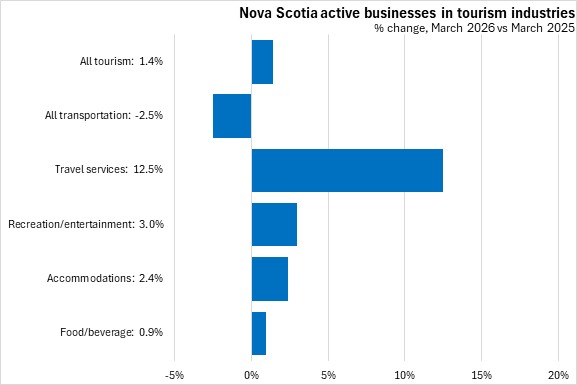
Statistics Canada has broken out specific data for tourism-related industries. Compared with March 2025, the number of active tourism-related businesses increased 1.4% in Nova Scotia as of March 2026, with gains in all subsectors except transportation (fastest: travel services).
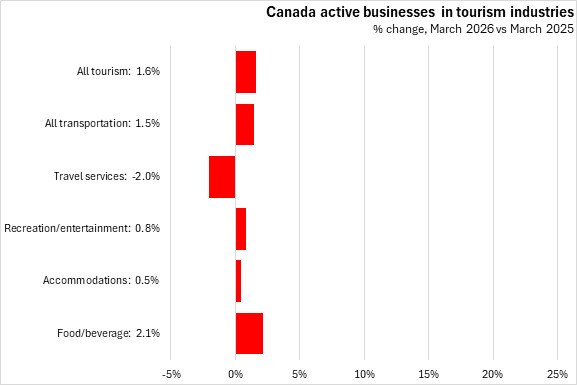
Nationally the number of tourism-related businesses was up 1.6% from March 2025 to March 2026, with transportation, accommodations, food/beverage and recreation/entertainment gains offsetting a decline in travel services.
Trends
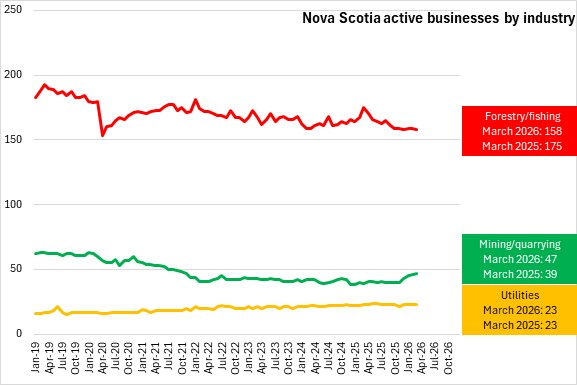
There has been a downward trend in forestry/fishing active businesses. Mining/quarrying has been increasing in recent months. The number of active businesses in the utilities sector has been steady in recent months.
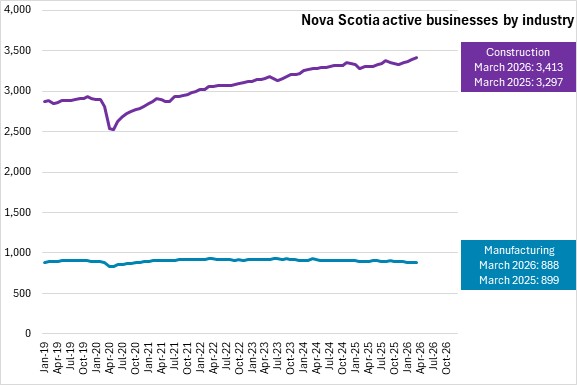
The number of active businesses in construction has been growing since 2020. Manufacturing businesses have slowly declined over the past two years.
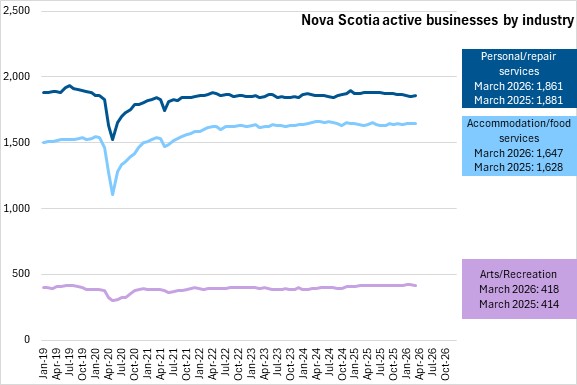
Personal/repair business counts have declined, while accommodation/food services and arts/recreation business counts have been relatively stable in recent months.
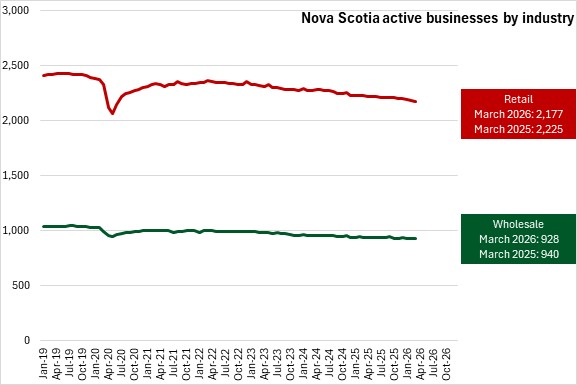
Retail and wholesale businesses have declined steadily in recent years.
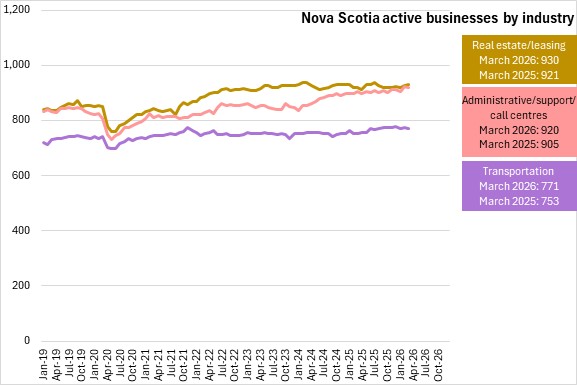
Active businesses in transportation have been rising slowly since early 2025, plateauing in recent months. The number of active businesses in real estate/leasing have resumed growth after a dip in late 2025. Active businesses in administrative/support/call centers have grown steadily since 2024.
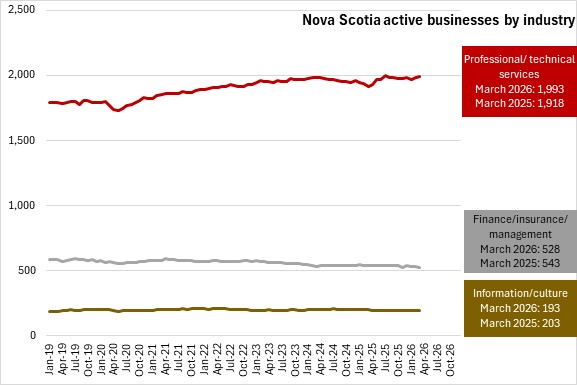
Professional/technical services active businesses grew in 2025, but this growth tapered off in the most recent months. Finance/insurance/management businesses as well as businesses in information/culture have been stable.
The source data is seasonally adjusted. The data may not aggregate due to firms being classified into multiple industry or geography.
Source: Statistics Canada. Table 33-10-0270-01 Experimental estimates for business openings and closures for Canada, provinces and territories, census metropolitan areas; Methodology: Business Opening and Closing
|